Download
1 / 27
280 likes | 532 Vues
Analysis of Particulate Contamination in Personal Dust Monitor Sampling. Jon C. Volkwein June 10, 2008 12 th U.S./North American Mine Ventilation Symposium, Reno, NV. Background. Personal Dust Monitor developed by R&P - PDM

E N D
Analysis of Particulate Contamination in Personal Dust Monitor Sampling Jon C. Volkwein June 10, 2008 12th U.S./North American Mine Ventilation Symposium, Reno, NV
Background • Personal Dust Monitor developed by R&P - PDM • Extensive testing by NIOSH demonstrated accuracy in lab and underground • Commercialized by Thermo Fisher Scientific • Currently undergoing approval by MSHA IS certification • Release by year end • Understanding new monitor versus old sampling method raised questions
Oversize Particles • MSHA allows 30 particles > 10 µm over 0.25 mm2 (~0.1 mg) • Greater numbers are grounds to void sample • Presumed sources with current sampler • Sampler misassembly • Dumped cyclones • Sample mishandle
Oversize on PDM filters minimized • No disassembly of critical cyclone components • HD cyclone is remote from filter and dump resistant • Automatic self-zero and mass measurement helps minimize mass error • Possible sources of oversize on filters • Contamination – Not counted in EOS exposure data • Before sampling • Post sampling • During sampling • During 30 min. warm-up – Not counted in EOS exposure data • During sampling • Penetration through cyclone • Internal contamination • Carry over from cyclone grit pot
Penetration through cyclone • Small but finite fraction greater than 10 µm • Properly operated cyclones are efficient and performance is well defined • Cyclones have been used for past 35 years • Unlikely source of oversize particulates
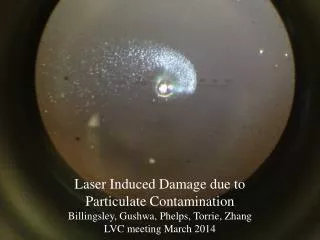
3-5µm stage 35µm Example of large ECD low density particle collected as respirable particle ECD
Cleaning procedures as source of internal contamination? • RI 9669 discussed a bias or loss of ~ 6% through the instrument transitions and heater assembly. • Does dry cleaning process remove this material? • Remove filter • Remove grit pot • Use compressed air to blow through all sample path openings
Internal contamination • Contaminants from inlet tubing to cyclone must pass through cyclone and be sized • Contaminants between the cyclone and filter- transition and heater zone possible Cyclone
Internal contamination • To test – needed “contaminated” PDMs • Retrieved 9 PDMs used in another test • Cleaned with normal routine for ~ 20 shifts • Placed a HEPA filter on inlet • Placed a clean - microscope counted filter • Ran for 25 min warm-up • Placed a second clean counted filter and sampled for 8 hours while PDM was in motion • Examined PDM reported mass
Internal contamination MSHA unit 116 • Used by inspectors in District 7 • Had some diesel exposure • Run on NIOSH apparatus • Mass gain 0.008 mg • 240 OSP in 34 fields
Internal contamination review • Microscopic observation indicates no significant particulate comes from internal surfaces • Mass is below limit of detection • Anecdotal evidence of low density OSP agglomerates in MSHA sample – mass below limit of detection
Carry over from cyclone grit pot -AKA Cyclone dumping • Act of inverting the cyclone such that oversize particles captured in the cyclone grit pot reenter the sampling air stream and become deposited on the filter. • Recommendation that Dorr-Oliver cyclone not be inverted beyond 120o • Detected by filter observation.
Dumping test • PDM and DO cyclones • Place 2 g of 20 µm glass spheres in cyclone grit pot • Invert during sampling 40 times about 2 axes • Examine filters with microscope
Example of glass beads Pre-test PDM filter Post-test PDM filter NIOSH test of dumping from cyclone grit pot
Microscopic evaluation of past field samples for oversize • Filters from prototype PDM sampling from JWR and Deer Creek were preserved • Side-by-side PDM and gravimetric samples taken from adjacent sides of cap light. • Filters retrieved and sent to MSHA for microscopic oversize evaluation • ~ 200 hours of routine cleaning
Filter appearance with measured amounts of dust mass Blank 0.009 mg 0.034 mg 0.026 mg
Oversize conclusion • Occasional oversize particles on PDM filters detected. • Mass from oversize < detectable limit • Were not able to induce cyclone dump • Past field samples did not contain oversize • Quantity of respirable dust to exceed detectable limit is substantial.
Cleaning conclusion • Deposits on internal sample flow path observed • Sources -- Impact of internal deposits – After an average of 437 hours of underground use and routine cleaning, PDM lab testing verified that instruments retained original accuracy (RI 9669) • Hinds (1982) Aerosol Technology – “particle attachment to surfaces is proportional to the particle diameter (d), while removal forces are proportional to d3” • Particles less than 10µm in size are not likely to be removed by common forces such a vibration or sampling air flows • Layers of larger agglomerated particles may be released • NIOSH procedures clean the agglomerates while leaving the more tightly bound respirable sized particulates
Cleaning conclusion (cont) • In practice, current cleaning procedures are adequate and samples are within normal sampling variance • Cannot, however, guarantee that one respirable particle from a previous sample does not deposit on the next sample. • This data demonstrated that if respirable particles are released, their mass is less than the detectable limit of the instrument and would be part of previously determined sampling error. • Verified in original report and by this work that field cleaned instruments do not cause error greater than documented instrument error.
? Jon Volkwein 412-386-6689 jvolkwein@cdc.gov