Analysis of Airborne Dust Sources: Quantifying Local and Long-Range Contributions
150 likes | 271 Vues
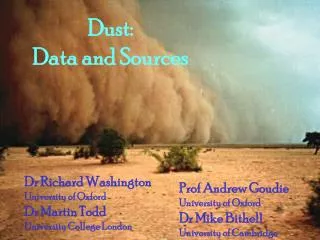
This study investigates the causes of airborne dust through comprehensive data analysis. It aims to identify and quantify various sources, including local and regional windblown dust, long-range transported dust (e.g., from Asia), and wildfire-related dust. Using data from the IMPROVE network and meteorological records, the research employs multivariate statistical methods to analyze dust concentrations in relation to wind speed, direction, and precipitation. The development of numerous databases facilitates a detailed understanding of dust events, improving predictive capabilities and highlighting significant dust sources.

Analysis of Airborne Dust Sources: Quantifying Local and Long-Range Contributions
E N D
Presentation Transcript
Causes of Dust. Data Analysis Ilias Kavouras, Vic Etyemezian, Dave DuBois, Mark Green, Marc Pitchford, Jin Xu Division of Atmospheric Sciences, Desert Research Institute
Scope and methodology Scope: identify and quantify sources of airborne dust • Local and regional windblown dust • Long-range transported dust (e.g. Asia) • Wildfire-related dust • Other unknown sources Approach: Analysis of IMPROVE network and meteorological data • Chemical fingerprints of dust (e.g. Asian, wildfire-related) • Multivariate statistical analysis of Dust concentrations, wind speed/direction and precipitation
Database development RAWS Days with precipitation for more than 12h or precipitation occurred after 12:00 p.m. CASTNET AZDEQ Central Meteorological Database Modified Central Meteorological Database ISH NPS NASA Grouped in 16 categories according to wind speed/direction WS1=0-14, WS2=14-20, WS3=20-26, WS4>26 mph WD1A=315-45, WD2A=45-135, WD3A=135-225, WD4A=225-315 WD1B=0-90, WD2B=90-180, WD3B=180-270, WD4B=270-360 “Dust” Database “Dust” Meteorological Database IMPROVE database
Sensitivity analysis Regression coefficients “Dust” Database “Model” Database GPS data Maps for each day IMPROVE-data YES/NO Meteo-data YES/NO “Dust” event YES/NO Precipitation YES/NO When? 0-12 or 12-24 “Worst” day YES/NO “Worst dust” day YES/NO
Statistical analysis – Multi-linear regression analysis • Measurement inter-correlations:Durbin-Watson test: mostly higher than 1.4 • Tolerance: higher than 0.80 • Linear regression was done using three methods: • Forward selection: One component is added (if p> [set value], rejected) • Backward selection: One component is removed if p> [set value] • Stepwise selection: One component is added; those with p > [set value] are eliminated
Statistical analysis – Criteria development • Significance level: 0.100 or 0.150 or higher • Valid prediction: Cpredicted– Epredicted > 0 or P0.05,Measured
1. Salt Creek – descriptive statistics Monitoring period: 01/01/01 – 12/31/03 IMPROVE database completeness: 93.2% Meteorological database completeness: 82.4% Measured dust mass Predicted dust mass
1. Salt Creek – Predicted vs. Measured Dust A-groups Worst dust days: 7 / 4 B-groups
2. Bandelier Nat. Mon.– descriptive statistics Monitoring period: 01/01/01 – 12/31/03 IMPROVE database completeness: 92.6% Meteorological database completeness: 76.4% Measured dust mass Predicted dust mass
2. Bandelier Nat.– Predicted vs. Measured Dust A-groups Worst dust days: 3 / 1 B-groups
Date: May 15, 2003 X: Worst day +: Worst dust day O: Meteorological data available