Download
1 / 16
350 likes | 1.64k Vues
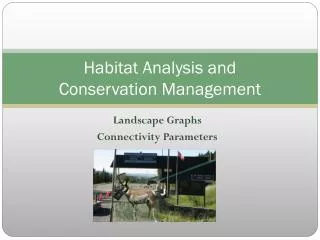
Habitat Analysis and Conservation Management. Landscape Graphs Connectivity Parameters. Landscape Ecology.

E N D
Habitat Analysis and Conservation Management Landscape Graphs Connectivity Parameters
Landscape Ecology Graphs are used to model complex landscapes, uncovering patterns of interaction or flow, to better analyze fluxes. This analysis provides guidance in land acquisition, reserve design, and management. Landscape graphs are defined by: Vertices consist of the landscape elements (e.g. local ecosystems, land uses, ecotopes, and biotopes - grasslands, bean fields, woods, highways, roads, rivers, streams, etc.) Edges represent common boundaries between elements or points where adjoining elements meet.
The Model Landscape Graphs are used to: • Identify common configurations within landscapes; • Understand the ecological and management implications of the configurations; • Examine the connectivity of elements in landscapes; • Understand relationships between dispersion, connectivity and stability; • Understand landscape changes and management’s optimal responses to these changes.
LandscapeConfigurations • Necklace Spider Cell Satellite or Pendant
More Landscape Configurations • Cross • Mesh or grid • Rigid polygon
Landscape Graph of a suburban rural area in Northwest Montana W = woods, F = field, L = house, R = road, B = bog, P = powerline
Habitat Networks • Habitat patches are vertices in the Habitat Network; • Habitat patches are connected by dispersing individuals and these connections arethe edges– a set threshold distance apart. • Useful graph theory terms: • Degree = number of patches (vertices) connected to a patch • Hub is a high degree vertex • Path is a route from one patch to another • Distance = D(x,y) = length of shortest path between x and y. • Component - a connected piece that is disconnected from the rest.
Travels of pronged horn antelope : Blue - December – March White- March – June, Red - July – September
Metrics • Clustering Coefficient – the average fraction of the vertex’s neighbors that are also neighbors of each other. high = dispersal (disease, disturbance) resilient to patch removal • Connectivity correlation – vertex degree/average vertex degree of its neighbors – measures compartmentalization- highly connected hubs high – slows movement and isolates resilient to diisturbances • Diameter – length of the longest shortest path Distance - D(x,y) - shortest path between x and y. • Characteristic path length (CPL) is the average shortest path lengths over all pairs of vertices Short = patchy population
Connectivity • A graph G is k - connected if k is the minimum number of vertices that need to be removed to disconnect the graph. • A graph G is n- neighbor connected if n is the minimum number of vertices along with their neighbors that need to be removed to disconnect the graph, leave the empty set, or a complete graph. a b e c d This graph is 3-connected – vertices c, e, b and 1 neighbor connected – vertex e
Edge Connectivity • A graph G is K-edge connected if K is the minimum number of edges that need to be removed to disconnect the graph. • A graph G is N-edge neighbor connected if N is the minimum number of edges along with their edge neighbors that need to be removed to disconnect the graph, leaves the empty set or a single vertex.. a d b c This graph is 2-edge connected red edges and 1-edge neighbor connected – blue edge