Snake River near Moran, WY
590 likes | 751 Vues
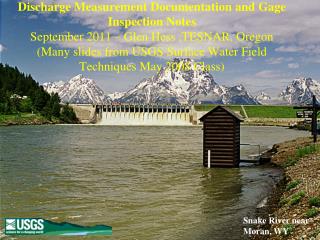
Discharge Measurement Documentation and Gage Inspection Notes September 2011 – Glen Hess ,TESNAR, Oregon (Many slides from USGS Surface Water Field Techniques May 2008 Class). Snake River near Moran, WY. Session Goals.

Snake River near Moran, WY
E N D
Presentation Transcript
Discharge Measurement Documentation and Gage Inspection NotesSeptember 2011 – Glen Hess ,TESNAR, Oregon (Many slides from USGS Surface Water Field Techniques May 2008 Class) Snake River near Moran, WY
Session Goals • Introduce the main document the USGS uses to record gage and discharge field data and information. • Prepare you so you can document field information during the field trip.
Session Objectives • Relate key factors that affect the quality of gaging station records. • Provide an overview of the main steps involved in checking and servicing a gaging station. • Review the standard note sheet as it relates to these key factors and main steps.
Definitions • Data—Results obtained from the measurement or observation of a basic variable, which CAN NOT BE REPEATED. • Information—Any changed or modified data value converts the value to information. (WRI 01-4044, pg 2, Section 3.1)
Discharge Measurement and Gage Inspection Notes • Provides information critical to the USGS mission of providing water resource information and interpretation. • Documents assessment of key factors that determine the quality of water discharge information.
Key Factors That Affect the Quality of Water Data and Information
Factor 1: Stage measurement accuracy and reliability Field notes document measurements and checks made to assess how accurate and reliable the gages measure stage.
Factor 2: Discharge measurement accuracy and variability Field notes document how well the water discharge can be measured.
Factor 3: Stage/discharge relation stability Field notes document whether the relation has changed since the last visit.
Factor 4: Stage/discharge relation Accuracy Field notes can add supporting evidence that the relation accurately represents the stream geometry and hydraulic conditions.
Factor 5: Adequate documentation of control conditions and supporting measurements Field notes document other supporting measurements and observations that may provide possible reasons for changes in the stage/discharge relation.
Why documenting these factors is important • Factors 1-5 relate to measurements and observations that can not be recovered in the office. • Data recorded on the field note are termed “Original Data” that should not be erased and/or over-written.
Main Servicing Steps • Record unique station identification, date, and party. • Read all gages. • Check functionality of all gages.
Main Servicing Steps—continued • Make a discharge measurement . • Reread all gages after the measurement . • Evaluate the stage/discharge relation . • Document control conditions . • Make other, supporting measurements .
Main Servicing Steps • Record unique station identification and date . • Read all gages . • Check functionality of all gages .
Station Identification • Each USGS gaging station has a unique NUMBER identifier that is related down stream order. • Each gage has a unique NAME that should not be abbreviated. • PARTY refers to the person(s) visiting the gage.
Main Servicing Steps • Record unique station identification and date . • Read all gages . • Check functionality of all gages .
Read All Gages • Note TIME and read the OUTSIDE, INSIDE, and RECORDING gages. • OUTSIDE reading should include observed accuracy (+/- due to any wave or surge). • Readings are documented at the START and FINISH of the measurement.
Basic Data Recorder Recording Gage
Read All Gages—continued • An Outside gage may be a Wire Weight or Chain: • Wire Weight—note CHECK BAR reading. • Chain—note CHAIN FOUND chain length (during levels). • CHANGED TO—note any changes made AT (time). • CORRECT—note correct length (from last levels).
Read All Gages—continued • Record any supplementary data collected: • SAMPLES COLLECTED. • MEASUREMENTS DOCUMENTED. • RAINGAGE SERVICED/CALIBRATED. • WEATHER. • AIR, WATER TEMP.
Main Servicing Steps • Record unique station identification and date . • Read all gages . • Check functionality of all gages .
Check Functionality of All Gages • GAGE OPERATING—”Yes” or “No” (if “No” why not?). • RECORD REMOVED • Logged data downloaded.
Check Functionality of All Gages—continued • BATTERY VOLTAGE • Check the supply under a load. • INTAKE/ORIFICE CLEANED/PURGED . • “Yes” cleaned or purged. • “No” not cleaned or purged.
Check Functionality of All Gages—continued • BUBBLE-GAGE PRESSURE, PSI • TANK—pressure in supply tank. • LINE—pressure from supply to line. • BUBBLE-RATE /MIN—rate of bubbles in Sight Feed recorded in bubbles per minute. • REMARKS—any pertinent condition that affects any gage’s functionality.
Main Servicing Steps • Document and make a discharge measurement . • Reread all gages after the measurement . • Evaluate the stage/discharge relation . • Document conditions . • Make other, supporting measurements .
The Measurement Note Sheet • The following information will be recorded for each discharge measurement: • Pass out example USGS note Discharge measurement note (9-275-F)
Measurement Note Sheet • Name of stream and location to correctly identify the established gaging station; or name of stream and exact location of site for a miscellaneous measurement. • Date, party, type of meter suspension, and meter number. • Time measurement was started using military time(24-hr clock system) • Bank of stream that was the starting point . • Control conditions. • Gage heights and corresponding times. • Water temperature. • Other pertinent information regarding the accuracy of the discharge measurement and conditions which might affect the stage-discharge relation.
Discharge Measurement • METER TYPE—AA or Pygmy. • METER NUMBER—unique identification number. • METER FT ABOVE BOTTOM OF WT • Noted when using a reel for Cableway or bridge measurements . • Depends on size of suspending weight and its position on a hanger bar.
Discharge Measurement—continued • RATING USED—the identification on the meter’s velocity Rating Table. • SPIN TEST BEFORE MEAS—time in minutes and seconds that the meter spun before the measurement. • AFTER—time in minutes and seconds that the meter spun before the measurement.
Discharge Measurement—continued • ANGLE COEFFICENT—the degree of approach of flow reference to the tagline or cross section. • DIST FROM INITIAL POINT—distance from the stream bank where the measurement was started. • WIDTH—Calculated mid-point from previous vertical to next vertical. Refer to second page of note sheet.
Discharge Measurement—continued • DEPTH—the depth of the stream at a specific vertical. • OBSERVATION DEPTH—the position of the meter in the vertical in relation to the water surface. • REVOLUTIONS—number of times the meter rotated in a given time. • TIME IN SECONDS—time interval that revolutions were counted.
Discharge Measurement—continued • VELOCITY— • AT POINT—velocity at location of meter in a vertical. • MEAN IN VERTICAL—mean of multiple velocity measurements in a vertical. • ADJUSTMENT FOR HOR ANGLE OR—any coefficient applied to the mean velocity in a vertical.
Discharge Measurement—continued • AREA—a calculation derived from the width and depth of a vertical. • DISCHARGE—a calculation derived by multiplying adjusted mean velocity and area.
Computation of Mean Gage Height for a Discharge Measurement • The mean gage height of a discharge measurement represents the mean stage of the stream during the measurement period. • When the change in stage is uniform and no greater than about 0.10 ft, the mean may be obtained by averaging the stage at the beginning and end of the measurement. • The clock time at the beginning and end of the measurement is recorded on the measurement notes, and additional readings should be recorded on the notes at intervals of 15 to 20 min during the measurement.
Computation of Mean Gage Height for a Discharge Measurement • If the change in stage is greater than 0.10 ft, or if the change is not uniform, the mean gage height is obtained by weighting the intermediate gage heights (by time or incremental discharge) to obtain a weighted mean gage height. (see Rantz, WSP 2175). • When extremely rapid changes in stage occur during a measurement, the weighted mean gage height is not truly applicable to the measured discharge. To reduce the range in stage, measurements should be made more rapidly than those made under constant or slowly changing stage.
Main Servicing Steps—continued • Make a discharge measurement . • Reread all gages after the measurement . • Evaluate the stage/discharge relation . • Document conditions . • Make other, supporting measurements .
Reread All Gages • Reread all gages as soon as possible after the measurement is completed. • Note FINISH TIME and read the OUTSIDE, INSIDE, and RECORDING gages.
Discharge Measurement—continued Refer to first page of note sheet. • WIDTH—total width of measurement cross section. • AREA—sum of all sub-area calculations. • VEL—derived by dividing the DISCH. By the AREA.
Discharge Measurement—continued • GH—mean gage height of measurement. • DISCH—sum of all sub-discharge calculations. • METHOD—at what depths below the surface velocity readings were obtained.
Discharge Measurement—continued • NO. SECS.—number of verticals including banks. • G.H. CHANGE—gage height change + or – during measurement and measurement duration. • METHOD COEF.—any coefficient applied because of a measurement method used.
Discharge Measurement—continued • HORIZ. ANGLE COEF.—transferred from back page of notes. • SUSP.—weight in pounds and type of suspension weight (50C = 50 lb Columbus). • TAGS CHECKED—”Yes” tags used; “No” no tags used.
Discharge Measurement—continued • WADING, CABLE…etc…—method and location of the discharge measurement. • MEASUREMENT RATED—subjective rating based on FLOW and CROSS SECTION conditions.
Main Servicing Steps—continued • Make a discharge measurement . • Reread all gages after the measurement . • Evaluate the stage/discharge relation . • Document conditions . • Make other, supporting measurements .
Evaluate Stage/Discharge Relation • MEAS. PLOTS—calculated from measured discharge and expected discharge. • RATING NO.—stage/discharge rating number currently in effect.