Download
1 / 13
130 likes | 270 Vues
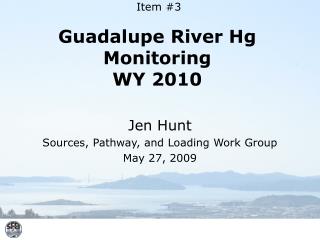
Guadalupe River Monitoring WY 2010. Jen Hunt, Ben Greenfield, Sarah Lowe, Lester McKee Sources, Pathway, and Loading Work Group May 6th, 2010. Guadalupe River WY 2010. Mercury monitoring funded by the Santa Clara Valley Water District for 2 locations on the Guadalupe River

E N D
Guadalupe River MonitoringWY 2010 Jen Hunt, Ben Greenfield, Sarah Lowe, Lester McKee Sources, Pathway, and Loading Work Group May 6th, 2010 Item 3b
Guadalupe River WY 2010 Mercury monitoring funded by the Santa Clara Valley Water District for 2 locations on the Guadalupe River Monitoring to assess progress towards attaining legacy and urban stormwater runoff mass load allocations for the TMDL PCB, PFC, and Dioxin monitoring funded by the RMP
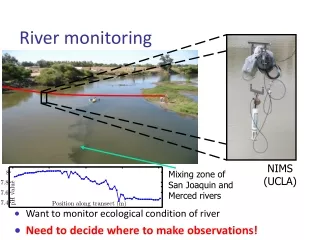
Why Guadalupe? • Known source of Hg to the Bay • Previous POC (Hg, PCB, PBDE) monitoring at GR 101 • High loadings of both PCBs and mercury detected in previous studies • Identified as a Status Monitoring Location in the MRP • USGS discharge station USGS/SCVWD/SFEI collaboration. Item 3b
STLS Informational Needs • Impairment: Which are the “high-leverage” small tributaries that contribute most to Bay impairment by pollutants of concern? • Loads: Determining average annual loads or concentrations of pollutants of concern from small tributaries to the Bay. • Provide data for modeling efforts. Item 3b
San Jose Precipitation1847-2010 134 Year Average =14.37 Item 3b
Mount Umunhum Precipitation 2000-2010 10 Year Average = 48.56 Item 3b
October 13th Storm Item 3b
Mercury Sample Collection • Samples for Mercury analysis collected from October 8, 2009 to April 28, 2010 • 100 THg (50 samples at 2 sites) • 50 DHg, TMeHg, DMeHg (25 samples at 2 sites) Item 3b
PCB Sample Collection • Samples for PCB analysis collected from October 8, 2009 to February 2010 • 40 Samples (20 samples at 2 Sites) Item 3b
Dioxin Sample Collection • Samples for Dioxin analysis collected from October 8, 2009 to February 2010 • 20 Samples (14 samples at GR101 and 6 samples at GRFOX) Item 3b
Preliminary Mercury Data Item 3b
Preliminary PCB Data Item 3b