Download
1 / 37
380 likes | 541 Vues
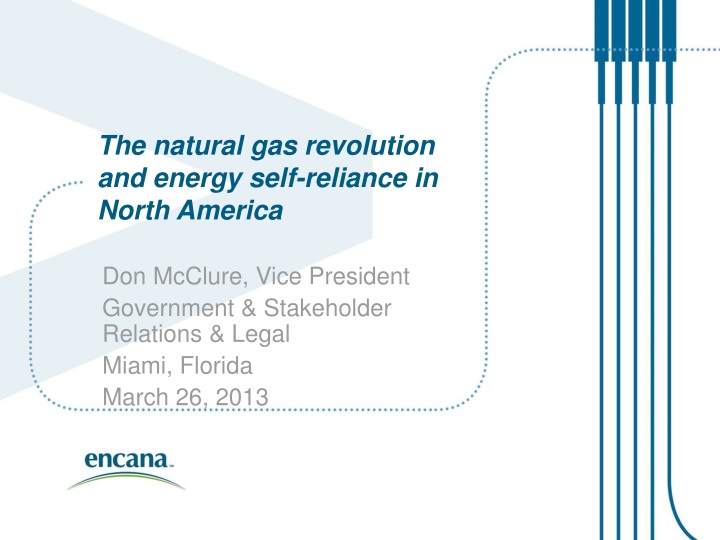
The natural gas revolution and energy self-reliance in North America. Don McClure, Vice President Government & Stakeholder Relations & Legal Miami, Florida March 26, 2013. Future Oriented Information.

E N D
The natural gas revolution and energy self-reliance in North America Don McClure, Vice President Government & Stakeholder Relations & Legal Miami, Florida March 26, 2013
Future Oriented Information In the interests of providing Encana shareholders and potential investors with information regarding Encana, including management’s assessment of Encana’s and its subsidiaries’ future plans and operations, certain statements contained in this presentation are forward-looking statements or information within the meaning of applicable securities legislation, collectively referred to herein as “forward-looking statements.” Forward-looking statements in this presentation include, but are not limited to: projections contained in the 2012 Corporate Guidance (including but not limited to estimates of cash flow, including per share amounts, natural gas, oil and natural gas liquids (“NGLs”) production, capital investment and its allocation, net divestitures, operating costs, and estimated 2012 sensitivities of cash flow and operating earnings); projections for 2013 (including but not limited to capital investment, net divestitures, net capital investment, natural gas, oil and NGLs and total liquids production, cash flow, net debt, and cash balance as of year-end); 2012 projected net debt and cash balance as of year-end; projection for long-term natural gas prices to reflect marginal supply cost; achieving a more balanced portfolio of production and cashflow; projected number of wells to be drilled in 2012 and their distribution among the Company’s plays; projected percentage shift of capital investments to liquids rich plays from 2012 to 2013 and expected cash flow contribution from liquids production by 2013; the flexibility of capital spending plans and the sources of funding therefore; the ability to maintain investment grade credit rating; ability to attract new joint venture capital and implement existing joint ventures; projection to maintain current level of dividends; the effect of the Company's risk management program, including the impact of commodity price hedges in 2012 and 2013; projections, estimates and future plans and strategies for the Canadian and USA Divisions, various properties, plays basins and other assets, including liquids content and production growth for 2012-2013, PIIP, COIP, NGIP and EUR, target well cost, drilling, completion and tie-in (“DCT”) costs, operating cost, transportation cost, drilling plans and well inventories, reductions in supply costs and estimates of reserves and economic contingent resources; forecast date of first natural gas production for Deep Panuke; projected coal to gas displacement for 2012 to 2013; expected coal unit retirements by 2025 and expected increase in potential natural gas demand; expected increase in natural gas demand from transportation; projected North American LNG export opportunity up to 2020, including from Kitimat LNG Project; short-, medium- and long-term projected increase in natural gas demand from various sectors; projected North American natural gas production from 2012 to 2013, including by product types; projected future North American natural gas prices; projected U.S. and Western Canadian ethane and propane supply and demand up to 2017; and expectations for NGLs' prices, supply and demand in the future. Readers are cautioned not to place undue reliance on forward-looking statements, as there can be no assurance that the plans, intentions or expectations upon which they are based will occur. By their nature, forward-looking statements involve numerous assumptions, known and unknown risks and uncertainties, both general and specific, that contribute to the possibility that the predictions, forecasts, projections and other forward-looking statements will not occur, which may cause the Company’s actual performance and financial results in future periods to differ materially from any estimates or projections of future performance or results expressed or implied by such forward-looking statements. These assumptions, risks and uncertainties include, among other things: volatility of, and assumptions regarding natural gas and liquids prices, including substantial or extended decline of the same and their adverse effect on the Company’s operations and financial condition and the value and amount of its reserves; assumptions based upon the Company’s current guidance; fluctuations in currency and interest rates; risk that the Company may not conclude divestitures of certain assets or other transactions (including third-party capital investments, farmoutsor partnerships, which Encana may refer to from time to time as “partnerships” or “joint ventures”, regardless of the legal form) as a result of various conditions not being met; product supply and demand; market competition; risks inherent in the Company’s and its subsidiaries’ marketing operations, including credit risks; imprecision of reserves estimates and estimates of recoverable quantities of natural gas and liquids from resource plays and other sources not currently classified as proved, probable or possible reserves or economic contingent resources, including future net revenue estimates; marketing margins; potential disruption or unexpected technical difficulties in developing new facilities; unexpected cost increases or technical difficulties in constructing or modifying processing facilities; risks associated with technology; the Company’s ability to acquire or find additional reserves; hedging activities resulting in realized and unrealized losses; business interruption and casualty losses; risk of the Company not operating all of its properties and assets; counterparty risk; downgrade in credit rating and its adverse effects; liability for indemnification obligations to third parties; variability of dividends to be paid; its ability to generate sufficient cash flow from operations to meet its current and future obligations; its ability to access external sources of debt and equity capital; the timing and the costs of well and pipeline construction; the Company’s ability to secure adequate product transportation; changes in royalty, tax, environmental, greenhouse gas, carbon, accounting and other laws or regulations or the interpretations of such laws or regulations; political and economic conditions in the countries in which the Company operates; terrorist threats; risks associated with existing and potential future lawsuits and regulatory actions made against the Company; risk arising from price basis differential; risk arising from inability to enter into attractive hedges to protect the Company’s capital program; and other risks and uncertainties described from time to time in the reports and filings made with securities regulatory authorities by Encana. Although Encana believes that the expectations represented by such forward-looking statements are reasonable, there can be no assurance that such expectations will prove to be correct. Readers are cautioned that the foregoing list of important factors is not exhaustive. In addition, assumptions relating to such forward-looking statements generally include Encana’s current expectations and projections made in light of, and generally consistent with, its historical experience and its perception of historical trends, including the conversion of resources into reserves and production as well as expectations regarding rates of advancement and innovation, generally consistent with and informed by its past experience, all of which are subject to the risk factors identified elsewhere in this presentation. Assumptions with respect to forward-looking information regarding expanding Encana's oil and NGLs production and extraction volumes are based on existing expansion of natural gas processing facilities in areas where Encana operates and the continued expansion and development of oil and NGL production from existing properties within its asset portfolio. Forward-looking information respecting anticipated 2012 cash flow for Encana is based upon, among other things, achieving average production for 2012 of 3.0 Bcf/d of natural gas and 30,000 bbls/d of liquids, commodity prices for natural gas and liquids based on NYMEX $3.25 per Mcf and WTI of $95 per bbl, an estimated U.S./Canadian dollar foreign exchange rate of $1.00 and a weighted average number of outstanding shares for Encana of approximately 736 million. Forward-looking information respecting anticipated 2013 cash flow for Encana is based upon achieving average production for 2013 of between 2.9 Bcf/d and 3.1 Bcf/d of natural gas and 60,000 bbls/d to 70,000 bbls/d of liquids, commodity prices for natural gas and liquids based on NYMEX $3.50 per Mcf and WTI of $90 per bbl, an estimated U.S./Canadian dollar foreign exchange rate of $1.00 and a weighted average number of outstanding shares for Encana of approximately 736 million. Furthermore, the forward‑looking statements contained in this presentation are made as of the date hereof and, except as required by law, Encana undertakes no obligation to update publicly or revise any forward‑looking statements, whether as a result of new information, future events or otherwise. The forward‑looking statements contained in this presentation are expressly qualified by this cautionary statement.
Advisory Regarding Reserves Data & Other Oil & Gas Information Disclosure Protocols National Instrument (“NI”) 51-101 of the Canadian Securities Administrators imposes oil and gas disclosure standards for Canadian public companies such as Encana engaged in oil and gas activities. Encana complies with the NI 51-101 annual disclosure requirements in its annual information form, most recently dated February 23, 2012 (“AIF”). The Canadian protocol disclosure is contained in Appendix A and under “Narrative Description of the Business” in the AIF. Encana has obtained an exemption dated January 4, 2011 from certain requirements of NI 51-101 to permit it to provide certain disclosure prepared in accordance with U.S. disclosure requirements, in addition to the Canadian protocol disclosure. That disclosure is primarily set forth in Appendix D of the AIF. Reserves are the estimated remaining quantities of oil and natural gas and related substances anticipated to be recoverable from known accumulations, from a given date forward, based on: analysis of drilling, geological, geophysical and engineering data, the use of established technology, and specified economic conditions, which are generally accepted as being reasonable. Proved reserves are those reserves which can be estimated with a high degree of certainty to be recoverable. It is likely that the actual remaining quantities recovered will exceed the estimated proved reserves. Probable reserves are those additional reserves that are less certain to be recovered than proved reserves. It is equally likely that the actual remaining quantities recovered will be greater or less than the sum of the estimated proved plus probable reserves. Possible reserves are those additional reserves that are less certain to be recovered than probable reserves. It is unlikely that the actual remaining quantities recovered will exceed the sum of the estimated proved plus probable plus possible reserves. The estimates of economic contingent resources contained in this presentation are based on definitions contained in the Canadian Oil and Gas Evaluation Handbook. Contingent resources do not constitute, and should not be confused with, reserves. Contingent resources are defined as those quantities of petroleum estimated, on a given date, to be potentially recoverable from known accumulations using established technology or technology under development, but which are not currently considered to be commercially recoverable due to one or more contingencies. Economic contingent resources are those contingent resources that are currently economically recoverable. In examining economic viability, the same fiscal conditions have been applied as in the estimation of reserves. There is a range of uncertainty of estimated recoverable volumes. A low estimate is considered to be a conservative estimate of the quantity that will actually be recovered. It is likely that the actual remaining quantities recovered will exceed the low estimate, which under probabilistic methodology reflects a 90 percent confidence level. A best estimate is considered to be a realistic estimate of the quantity that will actually be recovered. It is equally likely that the actual remaining quantities recovered will be greater or less than the best estimate, which under probabilistic methodology reflects a 50 percent confidence level. A high estimate is considered to be an optimistic estimate. It is unlikely that the actual remaining quantities recovered will exceed the high estimate, which under probabilistic methodology reflects a 10 percent confidence level. There is no certainty that it will be commercially viable to produce any portion of the volumes currently classified as economic contingent resources. The primary contingencies which currently prevent the classification of Encana's disclosed economic contingent resources as reserves include the lack of a reasonable expectation that all internal and external approvals will be forthcoming and the lack of a documented intent to develop the resources within a reasonable time frame. Other commercial considerations that may preclude the classification of contingent resources as reserves include factors such as legal, environmental, political and regulatory matters or a lack of markets. The estimates of various classes of reserves (proved, probable, possible) and of contingent resources (low, best, high) in this presentation represent arithmetic sums of multiple estimates of such classes for different properties, which statistical principles indicate may be misleading as to volumes that may actually be recovered. Readers should give attention to the estimates of individual classes of reserves and contingent resources and appreciate the differing probabilities of recovery associated with each class. Encana uses the terms resource play, total petroleum initially-in-place, natural gas-in-place, and crude oil-in-place. Resource play is a term used by Encana to describe an accumulation of hydrocarbons known to exist over a large areal expanse and/or thick vertical section, which when compared to a conventional play, typically has a lower geological and/or commercial development risk and lower average decline rate. Total petroleum initially-in-place (“PIIP”) is defined by the Society of Petroleum Engineers - Petroleum Resources Management System (“SPE-PRMS”) as that quantity of petroleum that is estimated to exist originally in naturally occurring accumulations. It includes that quantity of petroleum that is estimated, as of a given date, to be contained in known accumulations prior to production plus those estimated quantities in accumulations yet to be discovered (equivalent to “total resources”). Natural gas-in-place (“NGIP”) and crude oil-in-place (“COIP”) are defined in the same manner, with the substitution of “natural gas” and “crude oil” where appropriate for the word “petroleum”. As used by Encana, estimated ultimate recovery (“EUR”) has the meaning set out jointly by the Society of Petroleum Engineers and World Petroleum Congress in the year 2000, being those quantities of petroleum which are estimated, on a given date, to be potentially recoverable from an accumulation, plus those quantities already produced therefrom. In this presentation, Encana has provided information with respect to certain of its plays and emerging opportunities which is “analogous information” as defined in NI 51-101. This analogous information includes estimates of PIIP, NGIP, COIP or EUR, all as defined in the Canadian Oil & Gas Evaluation Handbook (“COGEH”) or by the SPE-PRMS, and/or production type curves. This analogous information is presented on a basin, sub-basin or area basis utilizing data derived from Encana's internal sources, as well as from a variety of publicly available information sources which are predominantly independent in nature. Some of this data may not have been prepared by qualified reserves evaluators or auditors and the preparation of any estimates may not be in strict accordance with COGEH. Regardless, estimates by engineering and geo-technical practitioners may vary and the differences may be significant. Encana believes that the provision of this analogous information is relevant to Encana's oil and gas activities, given its acreage position and operations (either ongoing or planned) in the areas in question. There is no certainty that it will be commercially viable to produce any portion of the estimated PIIP, NGIP, COIP or EUR. 30-day IP and short-term rates are not necessarily indicative of long-term performance or of ultimate recovery. In this presentation, certain oil and NGLs volumes have been converted to cubic feet equivalent (cfe) on the basis of one barrel (bbl) to six thousand cubic feet (Mcf). Cfe may be misleading, particularly if used in isolation. A conversion ratio of one bbl to six Mcf is based on an energy equivalency conversion method primarily applicable at the burner tip and does not represent value equivalency at the well head. Given that the value ratio based on the current price of oil as compared to natural gas is significantly different from the energy equivalency of 6:1, utilizing a conversion on a 6:1 basis may be misleading as an indication of value. For convenience, references in this presentation to “Encana”, the “Company”, “we”, “us” and “our” may, where applicable, refer only to or include any relevant direct and indirect subsidiary corporations and partnerships (“Subsidiaries”) of Encana Corporation, and the assets, activities and initiatives of such Subsidiaries.
Canada and United States: Importance of Energy Partnership Bi-Lateral Trade Oil Natural Gas Electricity Canada 6th largest oil producer in world (3 MMBbl/d in 2011) Canada 3rd largest oil reserves in world behind Saudi Arabia and Venezuela Common objectives to further strengthen environmental monitoring programs around air, land, water, and biodiversity
North American* Shale Play Activity * Canada and United States
Tremendous Asset Base Leading North American Portfolio of Resource Plays Biased to organic growth: We have amassed large, concentrated, contiguous land positions in the core of many of North America’s best resource plays – at low entry costs. Greater Sierra (inc. Horn River) CutbankRidge Peace River Arch Duvernay Bighorn Clearwater Clearwater Oil Collingwood/Utica Jonah Deep Panuke DJ Niobrara Niobrara/Mancos Piceance Mississippian Lime San Juan Haynesville Texas Tuscaloosa Resource Play Eaglebine Emerging Play
Horizontal Drilling Horizontal Drilling Traditional Wells
Hydraulic FracturingPumping fluid under high pressure to fracture formation Hydraulic Fractures • Creates fracture “highway” for gas to be rapidly produced from formation
9 9 9 Increase in Initial Production RatesThe Result of Shale Development Source: IHS Energy, Encana
Weekly Average NYMEX Prices NYMEX Historical Prices Prompt month traded significantly lower in 2012 than in the previous three years due to high storage levels coming off a warm winter. A more normal winter alleviated storage concerns, pushing prices back towards historical levels. US$/MMBtu Source: Encana Fundamentals, CME
Coal/Gas Comparison Source: Energy Information Administration
Carbon Dioxide Emission from Energy Consumption CO2 Emissions (Million Metric Tons of Carbon Dioxide) Year (January – October) Source: Energy Information Administration
Encana’s Vision for the Future Leading North American Resource Play Company Abundance of natural gas enables an energy plan that will include… • Natural gas as a preferred fuel for power generation • Natural gas as a transportation fuel • Expanded natural gas use in industrial applications • Accessing new markets – LNG export
% of Total Generation 60% Coal 50% 40% Natural Gas 30% 20% 10% 0% Jul-10 Jul-11 Jan-10 Jan-11 Jan-12 Mar-11 Mar-12 Mar-10 May-10 May-11 Sep-10 Sep-11 Nov-10 Nov-11 U.S Natural Gas Demand Story Strong Growth Continues Natural Gas Consumption (Bcf/d) Share of Power Generation Natural Gas Consumption Sectors (Bcf/d) Electric Industrial Residential Commercial Plant/Pipeline Transportation Source: Energy Information Administration (EIA); *3 year growth.
Coal-to-Gas Displacement Historical and Implied by Natural Gas Prices The forward curve implies a loss in coal-to-gas displacement of 2.9 Bcf/d from 2012-2013. Bcf/d 2.8 Source: Encana Fundamentals, EIA, Ventyx, NYMEX Note: forward curve as of January 30, 2013.
Long-term: Coal Unit Retirements 5 Bcf/d Demand Opportunity Between 2012 and 2025 50 GWs of coal-fired capacity retirements have been announced, representing a 5.4 Bcf/d potential NG demand opportunity. Source: Encana Fundamentals, company announcements.
Transportation and Oil & Gas Opportunity USA and Canada (Bcf/d) 2022 SCENARIO Natural gas fuels Adoption Current Fuel Consumption by Market Segment Cumulative Demand ~ 4 Bcf/d Displaceable Market Volume: 73 Bcfe/d Largest Opportunity C N G 47 Bcf/d Most Commercially Ready Influence on Early Adoption 15 Bcf/d 4 Bcf/d 4 Bcf/d 2 Bcf/d 1 Bcf/d L N G 818 MM kg CO2e (25%) 317 MM kg CO2e (28%) 85 MM kg CO2e (28%) 85 MM kg CO2e (28%) 42 MM kg CO2e (28%) 51 MM kg CO2e (28%) Potential GHG Emission Eliminations % – Forecast Segment Adoption Level Source: Data and forecast from EIA, Encana
The North American Market is Responding Infrastructure Growth and Recent Industry Announcements Total NGV Station Count Industry Announcements • Station Infrastructure • Shell/Travel Centers of America • 100 LNG stations planned • Clean Energy LNG station expansion • “America’s Natural Gas Highway” • Encana/Heckmann • Mobile and fixed stations • Over 100 new CNG stations planned • New Natural Gas Vehicles and Engines • “Big 3” offering pick-ups • Volvo/Navistar – on road • Cummins/Westport – on road • Caterpillar/Cummins – off road • Caterpillar/Westport – rail 96 Growth Since 2008 197 CNG Stations & 8 LNG Stations Total Capital ~$500 Million Source: Energy Information Administration (EIA), 2010; Statistics Canada; U.S. Dept of Energy AFDC.
Projected New Natural Gas Demand Creation Excellent Opportunities Diversified Across Many Sectors *A portion of this demand is currently being realized by natural gas.
Drilling for Oil Rig Shift The number of oil-directed rigs has more than tripled since January 2010, while the number of gas-directed rigs has dropped by approximately 58 percent. Rigs Source: Encana Fundamentals, Smith Bits
Challenges Post Election . . . Regulatory Uncertainty and Public Misperceptions Water Air • Potential contamination • Uses too much • Use produces same amount of energy regardless of energy source • Fluid management regulations • Methane leaks • Volatile organic compound emissions Land Values • Urban areas • Traffic • Noise • Surface disturbance • Industry does not care about the environment • Industry is highly profitable • Industry gouges public with excessive gasoline prices
Working through the challenges . . . Engage, Educate, Execute
Advancing Resource Play Hub Development Track Record of Continuous Supply Cost Reductions • Substantial cost reductions through resource play hub model • Multi-well pad using fit-for-purpose rig • Highly efficient repeatable process • Cost savings with minimal surface and environmental impact Formation core Hydraulic pressure fractures rock) Productive formation Concentrated resource + Pad drilling + Repeatable process = Resource Play Hub
How Do We Protect Ground Water?Safety at the Surface Multiple Layers of Groundwater Protection Surface Casing Cement Steel Surface Casing Aquifer Production Casing Cement* Steel Production Casing Production Tubing* *Geologic conditions do not always allow production casing cement to be circulated back to the surface; tubing not always utilized.
What’s in the Frac Fluid? 0.49%ADDITIVES Guar gum / Hydroxyethyl cellulose 0.056% Ammonium Persulfate 0.043% Potassium carbonate 0.011% Potassium chloride 0.06% Sodium chloride 0.01% Borate salts 0.007% Isopropanol 0.085% Citric acid 0.004% Petroleum distillate 0.088% N,n-dimethyl formamide 0.002% Glutaraldehyde 0.001% Acid 0.123% Other common uses: soap, cosmetics, ice-cream, toothpaste, water treatment, disinfectants, medicines Source: DOE, GWPC: Modern Gas Shale Development In the United States: A Primer (2009)
Introduction • The North American natural gas market has undergone a transformation in which the ability of the industry to deliver gas to the market has dramatically increased • Technological advances have unlocked a vast resource once thought uneconomic to develop • Shale gas plays now account for about 26 percent of North American natural gas production • Resource deliverability is driven by rig count • IHS Global Insight estimates that the shale gas industry contributed over 600,000 jobs in 2010 and expects by 2015 that number could increase to 870,000 jobs • Immense resource is available with supply cost between $4.00 and $6.00/MMBtu Note: North America refers to the United States and Canada unless noted otherwise
Vast Energy Resources in North America Technology Continues to Unlock Shale Gas Resource (Tcf) At 2011 consumption rates for North America (~27 Tcf) there is an estimated 86 to 149 years of supply 4,014 3,273 2,333 Confidential Source: National Petroleum Council, Potential Gas Committee, Canada National Energy Board, MITei, EIA
North American Annual Supply DeliverabilityAssessing the Future Potential Industry can deploy more rigs and deliver a larger volume of gas to the market in the future with nominal increase in supply cost Supply Cost $/MMBtu (9% after tax return; 2011 costs) • Approximate 50/50 spilt oil and gas rigs • Assumes current spud to completion times • Assumes 2011 industry supply cost structure Rig’s Running Deliverability from One Year of Drilling (Bcf/d) Confidential Source: Encana Fundamentals; *Note: Does not consider the impact of hedging, JV capital or well inventory.
N S 1500’ 950’ 6000’ from Surface to Williams Fork Producing Horizon 4800’ Pay zone = 3000’ thick Piceance Resource Play HubExtended Reach S-shaped Wells
Piceance Resource Play HubBest Management Practices • Multiple wells drilled from one pad • Reduces surface impact and rig moves • 52 wells on one 4.2 acre pad! • Three-phase gathering via pipeline • No tanks on location = no VOC emissions • Centralized production facility • Captures VOC’s • Treat & recycle over 90% of produced water • Frac water distribution via pipeline • Reduces truck trips >150,000/year • Closed-loop drilling system (all of Colorado) • Eliminates waste pit for drill cuttings
Ethane and its Derivatives Primarily Petrochemical Demand End-Use Demand Refinery/Industrial Fuel, ResCom Fuel (left in NG stream) C2+ NGL Stream (Fractionation) Ethane C2H6 (DeHydrogenation) (Turbo Expansion) Natural Gas Ethylene C2H4 Packaging Film, Bags, Bottles, Toys, Piping, Fuel Tanks Crude Oil Associated Gas % of Demand Polyethylene n-[C2H4]-n (Polymerization) 59% HDPE, LDPE, LLDPE (Oxidation) MEG Ethylene Oxide C2H4O Engine coolant, antifreeze, Polyester (Hydration) Ethylene Glycol HO–CH2CH2–OH 14% + H2O + O2 Lubricants, Laxatives, Skin creams, Toothpaste (Polymerization) Polyethylene Glycol H-(O-CH2-CH2)n-OH + H2O (Oligomerization) Alpha Olefins C4-C30 Lubricants, Surfactants, Wax, Alcohols 3% PVC (Chlorination) Ethylene Dichloride ClCH2-CH2Cl PolyVinyl Chloride ClCH2-CH2Cl Piping, Flooring, Siding, Fabrics, Sports, etc. 12% Chlorine (Alkylation) PolyStyrene [C6H5CH=CH2] Styrene C6H5CH=CH2 Ethylbenzene C6H5CH2CH3 Most widely used plastic, food packaging, foam packaging, etc. 7% Benzene (Polymerization) Other Uses 5%
Propane, Propylene & Derivatives All Kinds of Demand End-Use Demand Space Heating, Transport, Industrial, Farm Use C2+ NGL Stream (Fractionation) Propane C3H8 Refinery Output (DeHydrogenation) (Turbo Expansion) Natural Gas Propylene C3H6 Packaging, Food Containers, Banknotes, Fabrics, Auto parts Crude Oil Associated Gas % of Demand Polypropylene n-[C3H6]-n (Polymerization) 62% (Oxidation) Propylene Oxide CH3CHCH2O Polyurethane, polyester textiles, biological uses 8% + O2 Antifreeze, Preservative, Textile Base (Hydrolization) Propylene Glycol H-(O-CH2-CH2)n-OH (Oligomerization) Oxo Alcohols C4-C30 Plasticizers 8% (Alkylation) Cumene C6H5CH(CH3)2 Plastics Building block (Phenol) 12% Benzene (Ammoxidation) Acrylonitrile C3H3N ABS Plastic precursor, acids manufacture precursor, rubber precursor 10% Ammonia
U.S. Natural Gas Liquids Feedstocks for Petrochemical Production Ethane C2 Ethylene C2H4 Polyethylene (C2H4)n Propane C3 Propylene C3H6 Polypropylene (C3H6)n Benzene C6H6 Propane C3 Propylene C3H6 Cumene C6H6.C3H7 + Benzene C6H6 Phenol C6H5OH Propane C3 Propylene C3H6 Cumene C6H6.C3H7 + Source: Encana Fundamentals