Download
1 / 40
400 likes | 657 Vues
2016-17 Texas Academic Performance Report.

E N D
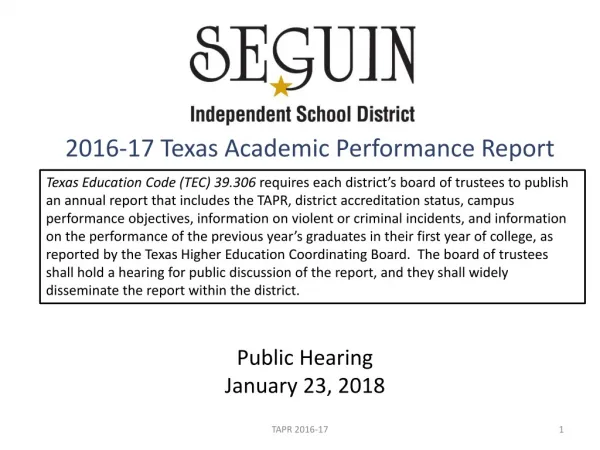
2016-17 Texas Academic Performance Report Texas Education Code (TEC) 39.306 requires each district’s board of trustees to publish an annual report that includes the TAPR, district accreditation status, campus performance objectives, information on violent or criminal incidents, and information on the performance of the previous year’s graduates in their first year of college, as reported by the Texas Higher Education Coordinating Board. The board of trustees shall hold a hearing for public discussion of the report, and they shall widely disseminate the report within the district. Public Hearing January 23, 2018 TAPR 2016-17
Texas Academic Performance Report (TAPR) Overview • 2017 TAPR provides information on: • student performance, staffing, programs and demographics on each school and district in Texas • 2017 District Accountability Rating: • “Met Standard” • 2017 Special Education Determination Status: • “Meets Requirements” TAPR 2016-17
Accessing the TAPR Report 1 https://tea.texas.gov/perfreport/tapr/index.html 2 http://seguinisd.net/page/homepage 3 Campus Libraries or Offices TAPR 2016-17
Changes to the 2016-17 TAPR Report • STAAR Performance Level Descriptors– STAAR results are categorized as Approaches Grade Level, Meets Grade Level, or Masters Grade Level. • Inclusion of 2016 STAAR Data – the 2016 STAAR data is included to allow for direct comparison of 2016 to 2017. The 15-16 TAPR only included one year of data. • Student Success Initiative (SSI) – The SSI grade-advancement requirement was suspended for 2015-16 school year. As a result, the following data have been removed for both reading and mathematics: • STAAR Non-Proficient Students Promoted by Grade Level Committee • STAAR Met Standard (Not Proficient in Previous Year) • Promoted to Grade 6 or 9 • Retained in Grade 5 or 8 TAPR 2016-17
Changes to the 2016-17 TAPR Report • Participation – STAAR participation data for 2016 is included to allow for comparisons of 2016 to 2017. • Graduation Rate– Lines have been added that indicate the 6-year extended federal graduation rate without exclusions for the Class of 2014 and Class of 2013. • Profile– Lines have been added that indicate the counts and percentages of students with disabilities. These counts are disaggregated by type of primary disability. • Mobility – Lines have been added that indicate the mobility rate by race/ethnicity. • Staff Information - Lines have been added that indicate the average years of experience of campus leadership. TAPR 2016-17
2017 TAPR ContentDistrict/Campus Performance • The performance section of the TAPR shows STAAR performance in different ways: • By grade level, subject, and student group • By End-of-Course (EOC) subject • All grades • STAAR Percentage at Approaches, Meets, and Masters Grade Level Standard • Student Success Initiative • Progress of Prior-Year Non-Proficient Students TAPR 2016-17
2017 TAPR ContentDistrict/Campus Performance (continued) • Participation Rate • Attendance Rate • Annual Dropout Rates • Graduation Rates • 4-year longitudinal • 5-year extended longitudinal • 6-year extended longitudinal • 4-year Federal • 5-year Federal • 6-year Federal TAPR 2016-17
2017 TAPR ContentDistrict/Campus Performance (continued) • College Readiness Indicators • RHSP and DAP Graduates • Advanced Courses/Dual Enrollment • College-Ready Graduates • Completion of Two or More Advanced/Dual Credit Courses in Current and/or Prior Year (Annual Graduates) • Completion of Twelve or More Hours of Postsecondary Credit (Annual Graduates) • CTE Coherent Sequence Graduates • AP/IB Results, SAT/ACT Results • Graduates Enrolled in a Texas Institution of Higher Education (IHE) • Gradates in a Texas IHE Completing One Year Without Remediation TAPR 2016-17
2017 TAPR Report OverviewDistrict/Campus Profile • Student Information • Demographics, Graduates, Retention Rates, Class Size • Staff Information • Demographics, Experience, Degrees, Salary Information, Turnover Rates • Programs • Student Enrollment, Teachers by Program • Budget • Link to Actual Financial Data report TAPR 2016-17
2017 STAAR 3-8 & EOC Summary(Percent at Approaches Grade Level or Above) Seguin ISD 2016-17 TAPR pages 1-3 TAPR 2016-17
2017 STAAR 3-8 & EOC Summary(Percent at Approaches Grade Level or Above) Seguin ISD 2016-17 TAPR pages 1-3 TAPR 2016-17
2017 STAAR 3-8 & EOC Summary(Percent at Approaches Grade Level or Above) Seguin ISD 2016-17 TAPR pages 1-3 TAPR 2016-17
2017 STAAR Progress % Met or Exceeded Progress % Exceeded Progress Seguin ISD 2016-17 TAPR pages 4-5 TAPR 2016-17
2017 TAPRAttendance & Dropout Rates 2015-16 School Year Seguin ISD 2016-17 TAPR page 12 TAPR 2016-17
4-Year Longitudinal Graduation Rate (Grades 9-12)Class of 2016 Cohort Seguin ISD 2016-17 TAPR page 12 TAPR 2016-17
5-Year Extended Longitudinal Graduation Rate (Grades 9-12)Class of 2015 Cohort Seguin ISD 2016-17 TAPR page 12 TAPR 2016-17
6-Year Extended Longitudinal Graduation Rate (Grades 9-12)Class of 2014 Cohort TAPR 2016-17 Seguin ISD 2016-17 TAPR page 13
Federal Graduation RateWithout Exclusions Seguin ISD 2016-17 TAPR page 13 TAPR 2016-17
Class of 2016 College Ready Graduates Seguin ISD 2016-17 TAPR page 15 TAPR 2016-17
Average SAT & ACT Scores(All Subjects) Seguin ISD 2016-17 TAPR page 17 TAPR 2016-17
2017 Student Ethnic Distribution Seguin ISD 2016-17 TAPR page 18 TAPR 2016-17
2016-17 TAPRStudent Information & Program Enrollment Seguin ISD 2016-17 TAPR page 18 Seguin ISD 2016-17 TAPR page 23 TAPR 2016-17
2017 Teacher Ethnic Distribution Seguin ISD 2016-17 TAPR page 21 TAPR 2016-17
2017 Teachers Years of Experience Seguin ISD 2016-17 TAPR page 21 TAPR 2016-17
2016-17 Accreditation Status TAPR 2016-17
Violent and Criminal Incidents • Texas statute (TEC 39.053) requires every district to publish an annual report on violent and criminal incidents at campuses in the district • The report must include: • Number, rate and type of incidents • Information concerning school violence prevention and intervention policies and procedures used by the district • Findings that result from Safe and Drug-Free Schools and Communities Act TAPR 2016-17
2016-17 Violent and Criminal Incidents Source: Seguin ISD PEIMS data TAPR 2016-17
School Violence Intervention Policies and Procedures • Security Officers on all secondary campuses • Website and mobile app tip-line • Coordination with Guadalupe County Juvenile Probation Services and local law enforcement • Canine dog searches TAPR 2016-17
Texas Higher Education Coordinating Board • Texas statute TEC 51.403(e) requires every district to include with its TAPR a report on student performance in postsecondary institutions during the first year enrolled after graduation from high school. The report includes: • Number of Total Graduates, disaggregated by attendance in Institutes of Higher Education • Number of Students within each GPA reporting band • Report can be found at http://www.txhighereddata.org/Interactive/HSCollLinkFilters/HSGradAcademicPerformance.cfm TAPR 2016-17
Accessing the PEIMS Financial Actual Reports http://tea.texas.gov/financialstandardreports/ TAPR 2016-17
2015-16 PEIMS Actual Financial Report TAPR 2016-17
2015-16 PEIMS Financial Actual Report (con’t) TAPR 2016-17
2015-16 PEIMS Financial Actual Report (con’t) TAPR 2016-17
2015-16 PEIMS Financial Actual Report (con’t) TAPR 2016-17
2015-16 PEIMS Financial Actual Report (con’t) TAPR 2016-17
Common QuestionsRefer to the 2016-17 TAPR Glossary for definitions, methodologies, data sources and other information to address commonly asked questions. The list below describes the most common causes of perceived inaccuracies in the TAPR or discrepancies between state and local data. • Time Frame – The time of data collection varies from indicator to indicator. • Static and Dynamic Data Sources – The TAPR compiles most data sets at a specific point in time to create an annual statistic. • Accountability Subset – The TAPR includes the STAAR results of only those students enrolled in the campus or district as of October 28, 2016. • Masking – The TAPR applies masking rules when needed to comply with the federal Family Educational Rights & Privacy Act. TAPR 2016-17
For more information, please contactJason SchmidtAssistant Superintendent of Learning & Leadership Servicesjschmidt@seguinisd.k12.tx.usCindy BordenDirector of State & Federal Accountabilitycborden@seguin.k12.tx.us TAPR 2016-17
![Texas Academic Performance Report (TAPR) 2017-2018 [ insert district name]](https://cdn4.slideserve.com/811019/texas-academic-performance-report-tapr-2017-2018-insert-district-name-dt.jpg)