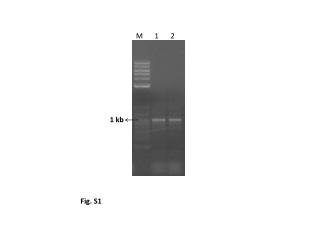
Effects of 1,25D3 on mRNA Expression in STZ-Treated Control Groups
This study evaluates the impact of 1,25D3 on mRNA expression levels in various control groups treated with STZ. The analysis includes mRNA transcripts of 9.5 kb and 7.5 kb in arbitrary units, measured against 28S rRNA for standardization. Results indicate notable variations in expression profiles, demonstrating the influence of 1,25D3 in the STZ-treated context. Understanding these dynamics could lead to improved therapeutic strategies in managing metabolic disorders linked to STZ administration.
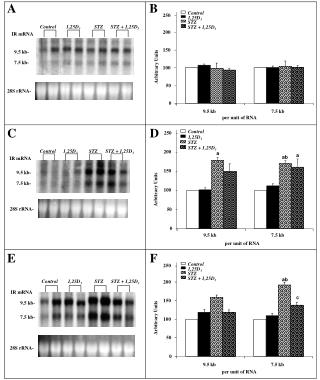

Effects of 1,25D3 on mRNA Expression in STZ-Treated Control Groups
E N D
Presentation Transcript
A B 250 Control 1,25D3 STZ STZ + 1,25D3 IR mRNA 200 9.5 kb- 150 7.5 kb- Arbitrary Units 100 50 28S rRNA- 0 9.5 kb 7.5 kb per unit of RNA C D 250 Control 1,25D3 STZ STZ + 1,25D3 a 200 a ab IR mRNA 9.5 kb- 150 7.5 kb- Arbitrary Units 100 28S rRNA- 50 Control Control Control 1,25D3 1,25D3 1,25D3 STZ STZ STZ 0 STZ + 1,25D3 STZ + 1,25D3 STZ + 1,25D3 9.5 kb 7.5 kb per unit of RNA E F 250 ab 200 Control 1,25D3 STZ STZ + 1,25D3 c IR mRNA 150 9.5 kb- Arbitrary Units 100 7.5 kb- 50 28S rRNA- 0 9.5 kb 7.5 kb per unit of RNA