Download
1 / 1
10 likes | 189 Vues
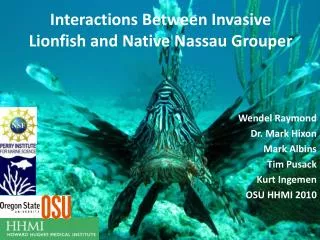
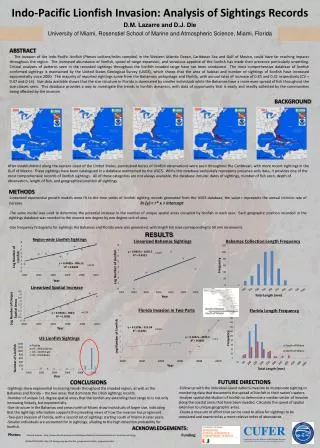
Indo-Pacific Lionfish Invasion: Analysis of Sightings Records D.M. Lazarre and D.J. Die University of Miami, Rosenstiel School of Marine and Atmospheric Science, Miami, Florida. 2010. Region-wide Lionfish Sightings. ABSTRACT

E N D
Indo-Pacific Lionfish Invasion: Analysis of Sightings Records D.M. Lazarre and D.J. Die University of Miami, Rosenstiel School of Marine and Atmospheric Science, Miami, Florida 2010 Region-wide Lionfish Sightings ABSTRACT The invasion of the Indo-Pacific lionfish (Pteroisvolitans/miles complex) in the Western Atlantic Ocean, Caribbean Sea and Gulf of Mexico, could have far reaching impacts throughout the region. The increased abundance of lionfish, speed of range expansion, and voracious appetite of the lionfish has made their presence particularly unsettling. Critical analyses of patterns seen in the recorded sightings throughout the lionfish invaded range have not been conducted. The most comprehensive database of lionfish confirmed sightings is maintained by the United States Geological Survey (USGS), which shows that the area of habitat and number of sightings of lionfish have increased exponentially since 2000. The majority of reported sightings come from the Bahamian archipelago and Florida, with annual rates of increase of 0.85 and 0.32 respectively (CV = 0.47 and 0.14). Size data available shows that the size structure in Florida is dominated by smaller individuals while the Bahamas have a more even spread of fish throughout the size classes seen. This database provides a way to investigate the trends in lionfish dynamics, with data of opportunity that is easily and readily collected by the communities being affected by the invasion. North of Miami South of Miami BACKGROUND After establishment along the eastern coast of the United States, punctuated bursts of lionfish observations were seen throughout the Caribbean, with more recent sightings in the Gulf of Mexico. These sightings have been catalogued in a database maintained by the USGS. While this database exclusively represents presence-only data, it provides one of the most comprehensive records of lionfish sightings. All of these categories are not always available, the database include: dates of sightings, number of fish seen, depth of observation, length of fish, and geographical position of sightings. METHODS -Linearized exponential growth models were fit to the time series of lionfish sighting records generated from the USGS database, the value r represents the annual intrinsic rate of increase. ln (y) = r* x + intercept -The same model was used to determine the potential increase in the number of unique spatial areas occupied by lionfish in each year. Each geographic position recorded in the sightings database was rounded to the nearest one degree by one degree unit of area. -Size frequency histograms for sightings the Bahamas and Florida were also generated, with length bin sizes corresponding to 50 mm increments. RESULTS Linearized Bahamas Sightings Bahamas Collection Length Frequency r=0.85 r=0.45 Linearized Spatial Increase Florida Invasion in Two Parts r=0.16 US Lionfish Sightings r=2.1 FUTURE DIRECTIONS -Follow up with the individual island nation’s invasion to incorporate sighting or monitoring data that documents the spread of lionfish in their nation’s waters. -Analyze spatial distribution of lionfish to determine a median vector of invasion along the coastal areas that have been invaded. Calculate the speed of spatial extension to unique geographic areas. -Create a measure of effort that can be used to allow for sightings to be compared and examined as a more relative index of abundance. CONCLUSIONS -Sightings show exponential increasing trends throughout the invaded region, as well as the Bahamas and Florida – the two areas that dominate the USGS sightings records. -Number of unique 1x1 degree spatial areas that the lionfish are extending their range to is not only increasing linearly, but exponentially. -Size structure in the Bahamas and areas north of Miami show individuals of larger size, indicating that the sightings information supports the prevailing views of how the invasion has progressed . -Two-part invasion of Florida, with a second set of sightings starting south of Miami in later years. -Smaller individuals are accounted for in sightings, alluding to the high detection probability for lionfish. CUFER Cooperative Unit for Fisheries and Education Research Cooperative Institute for Marine and Atmospheric Studies ACKNOWLEDGEMENTS: Photos: Richard Seaman - http://www.richard-seaman.com/Wallpaper/Nature/ Underwater/Horrors/ JuvenileLionfish.jpg NOAA/REEF/USGS- http://fl.biology.usgs.gov/lionfish_progression/lionfish_progression.html Funding: