Exploring Functions: Identify, Create Equations & Graphs
Learn about functions, identify functions, create input-output tables, write real-life function equations, and graph relationships. Practice examples provided.

Exploring Functions: Identify, Create Equations & Graphs
E N D
Presentation Transcript
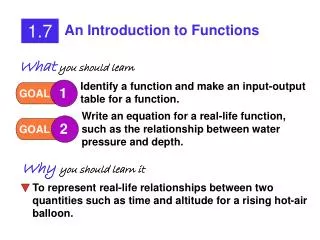
1.7 An Introduction to Functions 1 2 GOAL GOAL Identify a function and make an input-output table for a function. Write an equation for a real-life function, such as the relationship between water pressure and depth. Whatyou should learn
Functions • A relationship where one thing depends upon another is called a function. • A function is a rule that establishes a relationship between two quantities called the input and output. • In a function each input has exactly one output. More than one input can have the same output
Input n 1 2 3 Input n 1 2 1 Output 1 3 6 Output 1 3 6 Vocabulary Domain: collection of all input values. Range: collection of all output values. Again: Cannot have the same input (domain) more than once or it is NOT a function. NO YES
Identifying Functions • The key to identifying functions is the rule that each input has exactly one output. • If an input has more than one output…then the data is not a function • Often times you will be given a table or a list of ordered pairs be asked to identify if the data is a function. • Let’s look at some examples…
Identifying Functions • Look at the table to the right…notice that each input has exactly one output… • Therefore, this set of data is considered a function
Identifying Functions • Look at the table to the right…notice that the input of 9 has two different outputs (5 and 4 respectively) • Therefore, this set of data is not considered to be a function
Identifying Functions • Look at the table to the right…notice that the input of 1 and 2 have the same output of 3 • In this instance this is considered a function because each input has exactly one output…it’s ok to have different inputs with the same output
Your Turn – Identifying a Function • Does the table represent a function? Explain 3. 1. 2. 4.
Example 1 For the input 1, what is the output? For the input 3, what is the output? What is the domain of the function? What is the range of the function?
Vertical Line Test Function
EXAMPLE 2 Extra Example 1 • The profit on the school play is $4 per ticket minus $280, the expense to build the set. There are 300 seats in the theater. The profit for n tickets sold is • p = 4n – 280 for 70 ≤ n ≤ 300. • Make an input-output table. • b. Is this a function? • c. Describe the domain and range. Yes; none of the inputs are repeated. Domain: 70, 71, 72, 73,… , 300 Range: 0, 4, 8, 12,… ,920
Example 2 • You bicycle 4 mi and decide to ride for 2.5 more hours at 6 mi/hr. The distance you have traveled d after t hours is given by d = 4 + 6t, where 0 ≤ t ≤ 2.5. • Make an input-output table. Calculate d for each half-hour (t = 0, 0.5, 1, 1.5, 2, 2.5). • b. Draw a line graph.
4 WAYS TO DESCRIBE A FUNCTION • Input-Output Table • Description in Words • Equation • Graph
Checkpoint • A plane is at 2000 ft. It climbs at a rate of 1000 ft/min for 4 min. The altitude h for t minutes is given by • h = 2000 + 1000t for 0 ≤ t ≤ 4. • Make a table (use 0, 1, 2, 3, and 4 minutes). • Draw a line graph. • Describe the domain and range.
Checkpoint (cont.) Domain: all numbers between and including 0 and 4 Range: all numbers between and including 2000 and 6000 All numbers are included because time is continuous. This is what is shown by connecting the data points with a line. Even numbers such as 1.73 minutes or 2148.4 ft are included as the plane climbs.
1.7 An Introduction to Functions 2 WRITING EQUATIONS FOR FUNCTIONS GOAL EXAMPLE 3 • Use the problem solving strategy to: • Write a verbal model • Assign labels • Write an algebraic model
Example 3 • An internet service provider charges $9.00 for the first 10 hours and $0.95 per hour for any hours above 10 hours. Represent the cost c as a function of the number of hours (over 10) h. • Write an equation. • Create an input-output table for hours 10-14. • Make a line graph.
Example 3 (cont.) Rate per hour VERBAL MODEL Connection fee Number of hours Cost = + • LABELS c $9 $0.95 h ALGEBRAIC MODEL c = $9 + $0.95h
Checkpoint • The temperature at 6:00 a.m. was 62°F and rose 3°F every hour until 9:00 a.m. Represent the temperature T as a function of the number of hours h after 6:00 a.m. • Write an equation. • Make an input-output table, using a one-half hour interval. • Make a line graph.
Checkpoint (cont.) a. T = 62 + 3h b. c.
Homework • Pg. 49-50 Numbers 1-8, 14, 18, 22, 25