Systems of Linear Equations
150 likes | 266 Vues
This resource helps students recall key concepts of graphing linear equations through constructing value tables and understanding slopes and y-intercepts. By substituting values into equations like y=2x+1, students can create pairs of (x, y) values. These values can then be plotted on a coordinate grid to graph the linear equation. Additionally, the resource highlights the form y=mx+b, explaining how to identify slopes and y-intercepts. Completing quick check assignments reinforces learning and helps assess prior knowledge.

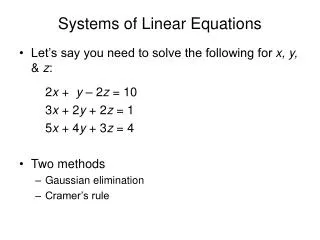
Systems of Linear Equations
E N D
Presentation Transcript
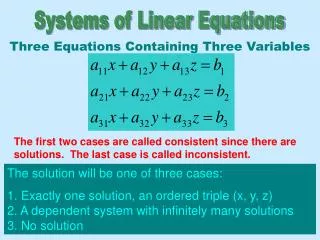
Systems ofLinear Equations Recalling Prior Knowledge
Recall Prior Knowledge • Graphing linear equations using a table of values (function table).
Recall Prior Knowledge • To graph a linear equation, you can first construct a table of x and y values. • For example, you substitute x =0 in the equation y =2x +1 to get the corresponding value of y.
Recall Prior Knowledge • From the table of values, you plot the pairs of values on a coordinate grid. Then jointhe points using a straight line to graph the linear equation.
Quick Check • Copy and complete the table of values for thelinear equation. Then draw itsgraph on a coordinate grid.
Recall Prior Knowledge Graphing linear equations using slopes and y-intercepts.
Recall Prior Knowledge • You can also graph linear equations by recognizing that linear equations have theform y =mx +b, where m is the slope and b is the y-intercept. • For example, for y =2x +1, the graph has slope 2 and intersects the y-axis at 1.
Quick Check • y =5x • y = 2x +2 • 2y =x – 2
Assignment: Assessing Your Prior Knowledge You are assigned problems 1 – 19 on page 367 in the red algebra I book. Remember, you can use your notes from previous units as well as the red algebra I book if you need help correctly solving the problems.