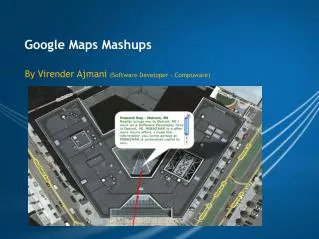

Interactive Google Maps with Random Points and Markers
E N D
Presentation Transcript
Point Mashups Peterson
var map; function initialize() { var myLatlng = new google.maps.LatLng(41.258531,-96.012599); var myOptions = { zoom: 18, center: myLatlng, mapTypeId: google.maps.MapTypeId.ROADMAP } map = new google.maps.Map(document.getElementById("map_canvas"), myOptions); // Define bounding box for random points var southWest = new google.maps.LatLng(41.12,-96.50); var northEast = new google.maps.LatLng(41.39, -95.60); var bounds = new google.maps.LatLngBounds(southWest,northEast); var lngSpan = northEast.lng() - southWest.lng(); var latSpan = northEast.lat() - southWest.lat(); // Add 5 markers to the map at random locations for (var i = 0; i < 5; i++) { var location = new google.maps.LatLng(southWest.lat() + latSpan * Math.random(), southWest.lng() + lngSpan * Math.random()); var j=i+1; var image = 'NumberedMarkers/largeTDRedIcons/marker' + j + ".png"; var marker = new google.maps.Marker({ position: location, icon: image, map: map }); var j = i + 1; marker.setTitle(j.toString()); attachMessage(marker, i);
XML File <markers> <marker lat="44.86" lng="-92.62" html="Some stuff to display in the<br>First Info Window" label="Marker One"/> <marker lat="45.01" lng="-93.18" html="Some stuff to display in the<br>Second Info Window" label="Marker Two"/> <marker lat="44.87" lng="-93.49" html="Some stuff to display in the<br>Third Info Window" label="Marker Three"/> </markers>
function initialize() { // create the map var myOptions = { zoom: 9, center: new google.maps.LatLng(44.96,-93.24), mapTypeControl: true, mapTypeControlOptions: {style: google.maps.MapTypeControlStyle.DROPDOWN_MENU}, navigationControl: true, mapTypeId: google.maps.MapTypeId.ROADMAP } map = new google.maps.Map(document.getElementById("map_canvas"), myOptions); google.maps.event.addListener(map, 'click', function() { infowindow.close(); }); // Read the data from example.xml downloadUrl("example.xml", function(doc) { var xmlDoc = xmlParse(doc); var markers = xmlDoc.documentElement.getElementsByTagName("marker"); for (var i = 0; i < markers.length; i++) { // obtain the attribues of each marker var lat = parseFloat(markers[i].getAttribute("lat")); var lng = parseFloat(markers[i].getAttribute("lng")); var point = new google.maps.LatLng(lat,lng); var html = markers[i].getAttribute("html"); var label = markers[i].getAttribute("label"); // create the marker var marker = createMarker(point,label,html); } // put the assembled side_bar_html contents into the side_bar div document.getElementById("side_bar").innerHTML = side_bar_html; }); }
Really Simple Syndication (RSS) function initialize() { // Center and zoom level are re-defined later based on points in georss feed var myLatlng = new google.maps.LatLng(49.496675,-102.65625); var myOptions = { zoom: 4, center: myLatlng, mapTypeId: google.maps.MapTypeId.ROADMAP } var map = new google.maps.Map(document.getElementById("map_canvas"), myOptions); var georssLayer = new google.maps.KmlLayer('http://api.flickr.com/services/feeds/geo/?g=322338@N20&lang=en-us&format=feed-georss'); georssLayer.setMap(map);
Google FusionTables function initialize() { var chicago = new google.maps.LatLng(41.850033, -87.6500523); map = new google.maps.Map(document.getElementById('map_canvas'), { center: chicago, zoom: 11, mapTypeId: 'roadmap' }); // View this table in a webpage: http://tables.googlelabs.com/DataSource?dsrcid=139529 layer = new google.maps.FusionTablesLayer(139529); layer.setMap(map);
Fusion Table Query function initialize() { var chicago = new google.maps.LatLng(41.968, -87.709); map = new google.maps.Map(document.getElementById('map_canvas'), { center: chicago, zoom: 10, mapTypeId: 'roadmap' }); // Select stops along the Red Line that had weekday ridership above a certain value layer = new google.maps.FusionTablesLayer(198945, { query: "SELECT address FROM 198945 WHERE ridership > 2000"} ); layer.setMap(map); }
<script type="text/javascript"> var geocoder; var map; function initialize() { geocoder = new google.maps.Geocoder(); var latlng = new google.maps.LatLng(41.258531,-96.012599); var myOptions = { zoom: 13, center: latlng, mapTypeId: google.maps.MapTypeId.ROADMAP } map = new google.maps.Map(document.getElementById("map_canvas"), myOptions); } function codeAddress() { var address = document.getElementById("address").value; geocoder.geocode( { 'address': address}, function(results, status) { if (status == google.maps.GeocoderStatus.OK) { map.setCenter(results[0].geometry.location); var marker = new google.maps.Marker({ map: map, position: results[0].geometry.location }); } else { alert("Geocode was not successful for the following reason: " + status); } }); } </script> </head> <body onload="initialize()"> <div> <input id="address" type="textbox" value="6001 Dodge, Omaha, NE" /> <input type="button" value="Geocode" onclick="codeAddress()" /> </div> <div id="map_canvas" style="height:90%"> </div> </body> Geocoding
Circle function From maps.google.circleoverlay.js // Create polygon points (extra point to close polygon) for (var i = 0; i < this.numPoints + 1; i++) { // Convert degrees to radians var theta = Math.PI * (i / (this.numPoints / 2)); var vertexLat = this.latLng.lat() + (circleLat * Math.sin(theta)); var vertexLng = this.latLng.lng() + (circleLng * Math.cos(theta)); var vertextLatLng = new google.maps.LatLng(vertexLat, vertexLng); circleLatLngs.push(vertextLatLng);
Graduated Symbols <script src="scripts/maps.google.circleoverlay.js" type="text/javascript"></script> <script type="text/javascript"> var map = null; function load() { // Create Map var center = new google.maps.LatLng(37.760,-122.416); map = new google.maps.Map(document.getElementById("map"), { center: center, zoom: 8, mapTypeId: google.maps.MapTypeId.ROADMAP }); // Draw the outside circle var circle1 = new CircleOverlay(map, map.getCenter(), 100, "#000000", 1, 1, '#009900', 0.25,100); // Draw the middle circle var circle2 = new CircleOverlay(map, map.getCenter(), 50, "#0000FF", 1, 1, '#0000FF', 0.25,100); // Draw the inside circle var circle3 = new CircleOverlay(map, map.getCenter(), 25, "#FF0000", 1, 1, '#FF0000', 0.25,100); } </script>