Download
1 / 9
90 likes | 203 Vues
This lesson covers the essential methods for graphing linear equations by identifying the X and Y intercepts. The X intercept refers to the point where the line crosses the x-axis (y=0), while the Y intercept is where it crosses the y-axis (x=0). Students will learn how to find these intercepts algebraically by substituting values into the equation of the line. Practical examples will be provided, allowing students to practice finding intercepts and graphing linear equations effectively.

E N D
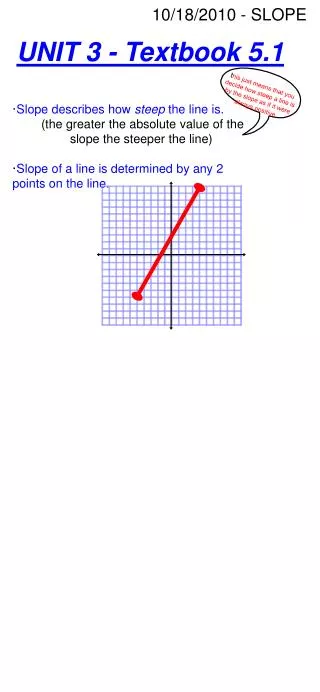
Unit 3, Lesson 2Textbook Section 4.5 October 9, 2009
Graphing Linear Equations USING THE X AND Y INTERCEPTS When we know that a function is linear, we can use just 2 points to graph a line: X intercept – the point where the line crosses the x-axis Y intercept – the point where the line crosses the y-axis Where y = 0 Where x = 0 In this example, what is the X intercept… Y intercept…
Sometimes we get the intercepts in a table. Find the intercepts below…
Find the intercepts from a linear equation. Find the intercepts then graph the equation. EXAMPLE: 3x + 2y = 9 TO FIND THE INTERCEPTS SET X = 0 AND SOLVE FOR Y. THEN SET Y = 0 AND SOLVE FOR X.
EXAMPLE 2: FIND THE INTERCEPTS AND GRAPH. 2X - 5Y = -10 SET X = 0 AND SOLVE FOR Y. THEN SET Y = 0 AND SOLVE FOR X.
EXAMPLE 2: FIND THE INTERCEPTS AND GRAPH. Y = 2 SET X = 0 AND SOLVE FOR Y. THEN SET Y = 0 AND SOLVE FOR X.