Reliability and Validity
Reliability and Validity. 9/5/2013. Readings. Chapter 3 Proposing Explanations, Framing Hypotheses, and Making Comparisons (Pollock) (pp.48-58) Chapter 1 Introduction to SPSS (Pollock Workbook) . Homework: Due 9/12. Chapter 1 Question 1 Parts A &B Question 2 . About the Homework.

Reliability and Validity
E N D
Presentation Transcript
Reliability and Validity 9/5/2013
Readings • Chapter 3 Proposing Explanations, Framing Hypotheses, and Making Comparisons (Pollock) (pp.48-58) • Chapter 1 Introduction to SPSS (Pollock Workbook)
Homework: Due 9/12 • Chapter 1 • Question 1 Parts A &B • Question 2
About the Homework • It must be turned in during class. • It cannot be emailed • It must appear on the workbook paper (original or a photocopy) • You cannot:
Office Hours For the Week • When • Monday 10-12:00 • Tuesday 8-12 • And by appointment
Course Learning Objectives • students will achieve competency in conducting statistical data analysis using the SPSS software program. • Students will learn the basics of research design and be able to critically analyze the advantages and disadvantages of different types of design.
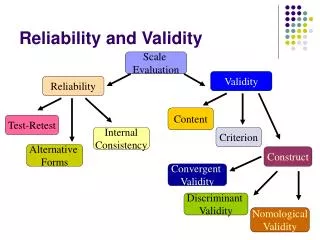
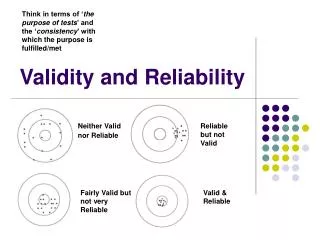
Measurement Validity • A measure is valid if it measures what it is supposed to measure • The measure and the concept correspond
Operational Validity • The measure does what it says • This can be difficult to establish
Face Validity • The simplest way to seek validity • The Measure looks good on its face • We ask People, use the literature • Problems?
Content Validity • Using several measures of a concept to get at the whole concept • Good for multi-dimensional concepts (e.g. political participation)
St. Edward’s Admissions • $50 Application fee • High School Transcript • SAT or ACT • Essay • Recommendation Form
Trust in Government • Trust the Federal Government • Is the Government Run for the Benefit of All • Do People in Government Waste Tax Money • Are Government Officials Crooked
Freedom House Index • 27 Questions • Electoral process • Political pluralism & participation • Functioning of government • Freedom of expression & belief • Associational & organizational rights • Rule of law • Personal autonomy and individual rights
LEED Building Leadership in Energy and Environmental Design
Predictive Validity • Using a measure to predict a future outcome • This is very difficult in the social sciences
The NFL Combines • 40-yard dash • Bench press • Vertical jump • Broad jump • 3 cone drill • Shuttle run
The LSAT’s • The LSAT is designed to measure skills that are considered essential for success in law school • The LSAT is a strong predictor of first-year law school grades • What doesn’t it measure?
Measurement Reliability • A measurement will provide the same results upon repeated tests • The more consistent the results… the more reliable the measure
Random Error • Outside of the control of the researcher • Outlier case • People’s feelings • weather • Large sample sizes reduce this
Non-Random Error • Systemic Researcher Error • Poor design • Lazy administration • Intentional error • Small samples • carelessness • This will distort the measure of a concept
Ensuring Reliability • Good Definitions and unambiguous questions • Clear Directions • Making results and information available to other researchers
Methods for ensuring Reliability • Alternative forms technique • Test-Retest
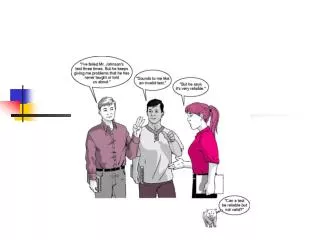
A measure can be reliable without being valid, but a measure cannot be valid without being reliable!
A way of getting content validity Indexes and Scales
Why create a scale/index? • To form a composite measure of a complex phenomenon by using two or more items • Get at all facets • Simplify our data
Examples • GPA
Likert Scale • A common way of creating a scale • Advantages • Disadvantages
Guttman Scaling • Employs a series of items to produce a score for respondents • Ordering questions that become harder to agree with • Advantages and disadvantages
SPSS Statistical Package for the Social Sciences
What is a statistical package • Popular Versions • SPSS • SAS • R • Stata
Getting SPSS Don’t Do Use it on the machines on campus- free! Consider purchasing a 6-month license (52.00 + 4.99 download fee) • Purchase a student version • Limited functions • Limited variables • Searching the internet for a “free version” • You might get a virus • The Russians will steal your identity (exception fallacy).
How to Open Data files • Data Files on the Pollack CD • GSS2008.SAV- the 2008 General Social Survey Dataset • n=2023 • 301 variables • NES2008.SAV- the National Election Study from 2008. n=2323 • 302 variables • STATES.SAV- aggregate level data for the 50 States. N=50 • 82 Variables • WORLD.SAV- aggregate level data for the nations of the world. n=191 • 69 Variables
SPSS uses 2 windows • Data Editor Window • is used to define and enter your data and to perform statistical procedures. • very spread-sheet like • .sav extension • The Output Window • this is where results of statistical tests appear • This opens when you run your first test • .spv extension
It is like a spreadsheet • In Variable View • You define your parameters • Give variables names • Operationalize variables • We will not do a lot of this
Names and Labels Name Labels A longer definition of the variable These describe the actual variable • how the label appears at the top of the column (like the first row in excel) • you cant use dashes, special characters or start with numbers • These should represent the variable
Value Labels • This shows how variables are operationalized • Value= the numeric value given to a category • Label= the attribute of the concept
In Data View • You type in raw data • It looks very much like Excel • Rows= cases • Columns= Variables
How Things are Displayed Edit • Options • Display names • Alphabetical
Variables I Like Values and Labels
Exiting SPSS • If you changed the actual dataset you must save it • If you ran any statistics, you must save these as well