Validity and Reliability
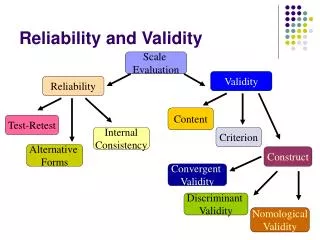
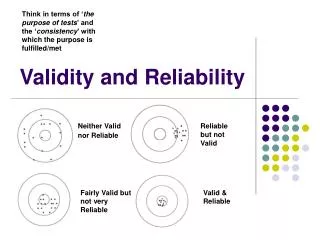
Validity and Reliability. Validity and Reliability. Illustration of Types of Evidence of Validity (Figure 8.1). Reliability and Validity (Figure 8.2). Reliability of Measurement (Figure 8.3). Validity (“Truthfulness”) Method Procedure Content-related evidence Expert judgment


Validity and Reliability
E N D
Presentation Transcript
Validity (“Truthfulness”) Method Procedure Content-related evidence Expert judgment Criterion-related evidence Relate to another measure of the same variable Construct-related evidence Assess evidence on predictions made from theory Reliability (“Consistency”) Method Content Time Interval Procedure Test-retest Identical Varies Give identical instrument twice Equivalent forms Different None Give two forms of instrument Equivalent forms/retest Different Varies Give two forms of instrument, with time interval between Internal consistency Different None Divide instrument into halves and score each or use KR Observer agreement Identical None Compare scores obtained by two or more observers Methods of Checking Validity and Reliability (Table 8.2)
Educational Research Chapter 13 Experimental Research Gay and Airasian
13 Experimental Research
Key Characteristics of Experimental Designs • Procedures are designed that address potential threats to validity • Internal • External • Construct • Statistical Conclusion • Statistical comparisons of different groups are conducted
Selecting Participants and Assigning Them to Treatments • Decide on the experimental unit of analysis to be treated • individual • group or groups • organization • Randomly assign individuals to groups control for extraneous characteristics that might influence the outcome
Topics Discussed in this Chapter • Defining characteristics • The experimental process • Manipulation and control • Threats to validity • Internal validity • External validity • Group designs • Single subject designs
Defining Characteristics • Research designed to investigate cause and effect relationships through the direct manipulation of an independent variable and control of extraneous variables • Independent variable – the variable being manipulated • Dependent variable – the variable in which the effect of the manipulation of the independent variable are observed • Researcher manipulation and control – choice of treatments, choice of a research design, use of specific procedures, etc.
Experimental Process • Selection and definition of problem • Selection of participants & instruments • Selection and assignment of participants • Selection of research plan • Comparison of two approaches • Comparison of new versus existing approaches • Comparison of different amounts of single approach • Execution of research plan • Sufficient exposure to treatment • Operationally different treatments • Analysis of data • Formulation of conclusions
Manipulation and Control • Manipulation • The researcher’s decisions related to what will make up the independent variable • Active variables versus assigned variables • Control • The researcher’s efforts to remove the influence of any extraneous variables that might have an effect on the dependent variable • The goal is to be assured the only differences between groups is that related to the independent variable
9 Internal Validity
Experimental Validity • Internal validity – the degree to which the results are attributable to the independent variable and not some other rival explanation • External/ecological validity – the extent to which the results of a study are generalizable • Relative importance of internal and external validity
Threats to Internal Validity • History • Maturation • Testing • Instrumentation • Statistical regression • Differential selection of participants • Mortality • Selection-maturation interaction, etc.
Technique Obtain More Obtain More Choose Standardize Information Information Appropriate Threat Conditions on Subjects on Details Design Subject characteristics X X Mortality X X Location X X Instrumentation X X Testing X History X X Maturation X X Subject attitude X X X Regression X X Implementation X X X Techniques for Controlling Threats to Internal Validity(Table 9.1)
Threats to External Validity • Pre-test treatment interaction • Multiple treatment interference • Selection treatment interaction • Specificity of variables • Treatment diffusion • Experimenter effects • Reactive arrangements • Artificial environment • Hawthorne effect • John Henry effect • Placebo effect • Novelty effect
Controlling for Extraneous Variables • Randomization • Selection • Assignment • Matching • Identifying pairs of subjects “matched” on specific characteristics of interest • Randomly assigning subjects from each pair to different groups • Difficulty with subjects for whom no match exists
A Randomized Posttest-Only Control Group Design, Using Matched Subjects (Figure 13.7)
Matching Process Based on Gender John Jim James Josh Jackson Jane Johanna Julie Jean Jeb Experimental Group Control Group
Controlling for Extraneous Variables • Comparing homogeneous groups • Restricting subjects to those with similar characteristics • Problems related to restriction of generalization • Build the variable into the design (e.g., factorial design) • Using subjects as their own controls • Multiple treatments across time • Problem with carry-over effect • Analysis of covariance (ANCOVA)
Group Designs • Two major classes of designs • Single-variable designs – one independent variable • Factorial designs – two or more independent variables • Three types of designs • Pre-experimental designs • Experimental designs • Quasi-experimental designs
Pre-Experimental Designs • Types • One-shot case study • One-group pretest-posttest design • Static group comparison • Threats to internal validity – see Figure 13.1
Example of a Randomized Posttest-Only Control Group Design (Figure 13.4)
Example of a Randomized Solomon Four-Group Design (Figure 13.6)
Example of a One-Group Pretest-Posttest Design (Figure 13.2)
Example of a Randomized Posttest-Only Control Group Design (Figure 13.4)
True Experimental Designs • Types • Pretest-posttest control group design • Posttest only control group design • Solomon four-group comparison • Threats to internal validity – see Figure 13.2
Example of a Randomized Pretest-Posttest Control Group Design(Figure 13.5)
Quasi-Experimental Designs • Types • Non-equivalent control group design • Time series design • Counterbalanced design • Threats to internal validity – see Figure 13.2
Results (Means) from a Study Using a Counterbalanced Design(Figure 13.8)
Possible Outcome Patterns in a Time-Series Design(Figure 13.9)
Using a Factorial Design to Study Effects of Method and Class Size on Achievement (Figure 13.10)