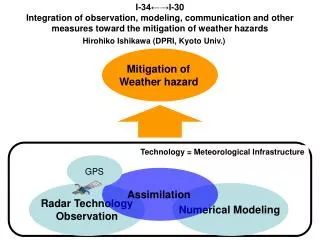
Technology = Meteorological Infrastructure
I-34←→I-30 Integration of observation, modeling, communication and other measures toward the mitigation of weather hazards. Mitigation of Weather hazard. Technology = Meteorological Infrastructure. GPS. Hirohiko Ishikawa (DPRI, Kyoto Univ.). Assimilation. Radar Technology Observation.

Technology = Meteorological Infrastructure
E N D
Presentation Transcript
I-34←→I-30Integration of observation, modeling, communication and other measures toward the mitigation of weather hazards Mitigation of Weather hazard Technology = Meteorological Infrastructure GPS Hirohiko Ishikawa (DPRI, Kyoto Univ.) Assimilation Radar Technology Observation Numerical Modeling
Weather hazards are caused by extreme weather conditions which are brought by specific meteorological disturbances. First of all, I briefly view the disastrous weather around Japan. Mitigative actionWarnings, Alerts, Evacuation etc. Weather HazardsFlood, Fresh flood, storm surge, landslide etc. Extreme weather conditionHeavy rain, High wind, High/Low temperature etc. MeteorologyTyphoon, Extra-tropical cyclone, Local Storm etc. Meteorological DisturbancesTyphoon, Extra-tropical cyclone, Local Storm etc.
MeteorologyTyphoon, Extra-tropical cyclone, Local Storm etc. Composite of 1945-2007 Tropical Cyclone tracks from JTWC TYPHOON CYCLONE All the more tropical cyclones are the most hazardous meteorological disturbance in Asia.This is the composite of Tropical cyclone tracks from 1945 to 2007. The track data are taken from Joint Typhoon Warning Center. The color of track corresponds intensity.
Frequency of genesis(26.6) Frequency of close access to Japan island(11.6) Frequency of land on to Japan islands(3.0) Frequency of Typhoon in northwest Pacific Taken from JMA MeteorologyTyphoon, Extra-tropical cyclone, Local Storm etc.
Extratropical Transition of Typhoon__BART(1999) Re-intensification as an ET ET-Transition Axi-symmetric structure Severe weather takes place during the transition. Pre-existing frontal zone sometimes brings very heavy and continuous rainfall. Fast moving vortex results in very strong surface wind on the right-hand side of typhoon path. MeteorologyTyphoon, Extra-tropical cyclone, Local Storm etc.
Surface Pressure ET Cyclone Typhoon Distance from Cyclone Center (km) Gradient Wind Speed Distance from Cyclone Center (km) Feb. 22, 1994 Explosively developing mid-latitudecyclone in winter season is another cause of hazardous weather. This is an example of the case. The low pressure is generated to the south of Kyusyu and was developed as deep as 954 hPa in two days. MeteorologyTyphoon, Extra-tropical cyclone, Local Storm etc.
Annual Frequency of Tornado (TATSUMAKI(竜巻)=Dragon wheel) Seasonality & Synoptic Conditions Other 1961-1992 Low Front Typhoon BART, 1999 Hayashi & Mitsuta, 1993 Yoshino & Ishikawa MeteorologyTyphoon, Extra-tropical cyclone, Local Storm etc.
Recent NAMED Heavy Rain Event Associated with BAIU Front(According to Yoshizaki & Kato) • Nagasaki 1982.7.23 • Shimane 1983.7.23 • Shimane 1985.7.5-6 • Shimane 1988.7.15 • Kagoshima 1993.8.1 • Izumi 1997.7.9 • Niigata 1998.8.4 • Kochi 1998.9.4 • Fukuoka/Hiroshima 19986.29 • Fukuoka 2003.7.20 • Kumamoto 2003.7.20 • Niigata Fukushima 2004.7.13 • Fukui 2004.7.18 Total Precipitation Death and Lost: 437 Injured:1175 Max I h Precipitation MeteorologyBAIU (Rainy season: mid-June to late-July)
It is necessary that the possibility of hazards must be specified and transferred to the decision maker before he conducst mitigative action (,but actuary this is the most difficult).. Mitigative actionWarnings, Alerts, Evacuation etc. HazardFlood, Fresh flood, storm surge, landslide etc. HazardFlood, Fresh flood, storm surge, landslide etc. Extreme weather conditionHeavy rain, High wind, High/Low temperature etc. MeteorologyTyphoon, Extra-tropical cyclone, Local Storm etc.
Meteorology and Hazards (NWP) Meso-Meteorology DataAssimilation Model Coupling Rain output Wind output River DischargeModel GISStatic Info.Etc. Coastal Hazards Met AnalysisSatellite DataRadar Data Etc. Storm Surge Wave Model WindHazards WindHazards Flood WaterResources Landslide FloodSimulation River BasinEnvironment Modeling Sedimentmodel Winddurability LES
Wind Hazard Damage rate of house to maximum wind Damage Rate vs. Max. WInd Damage Rate Comparison of damage rate with maximum surface wind obtained by hind-casting by NWP model Obs. Max. Wind (m/s) The relation of wind and wind hazard is straightforward. If we know the relation between wind speed and damage, the damage is evaluated using the predicted wind speed. The center figure is the distribution of house damage rate during the passage of a typhoon, and the right-hand figure is the Distribution of computed maximum wind speed. The distribution pattern looks similar. For the quantitative estimation, however, we have to know how the NWP wind relates observation. (with courtesy of Prof. Maruyama at DPRI)
What does the NWP wind stand for? Observation (1 sec interval) Observation (1 min running mean) The NWP (u,v) corresponds to about 10 minutes average of natural wind. Observation (5 min running mean) NWP Output (10 sec interval) Observation (10 min running mean) Comparison of NWP output to observation with different averaging time. (with courtesy of Prof. Maruyama at DPRI)
Flood Nagoya(September 2000) Inundation: Precipitation rate vs. Drainage Clean waterinundation Break River Muddy waterflood Flood: River discharge, water level, bank C-8, I32 and I33 With courtesy of Prof. Toda at DPRI
Storm surge/High wave Typhoon BART (T9919) 12 casualty Inundation Bank break I-30=> I-34 With courtesy of Prof. Takikawa Kumamoto U
Storm surge/High wave Implementation of Atmosphere/Wave/Ocean combined modeling Many other simple 1-way model Mesoscale Numerical Prediction(ARPS, MM5, WRF) Improvement of Intensity Prediction Wind velocity Psfc, Wind velocity Bottom B.C. Wave stress Wave Prediction(WW3, SWAN) Ocean Current(POM, 2D-model) Storm SurgeCoastal Damage High WaveCoastal Damage
Landslide • It depends on • Local topography (inclination …) • Soil characteristics (type, texture, vertical structure…) • Rainfall and its distribution in both time and space • Accumulated precipitation / Short-term precipitation intensity • Interaction with earthquake Courtesy Prof. Fujita DPRI
Landslide A July 1997 slide-debris flow in Izumi city induced by heavy rainstorm, Japan Provided by Prof. Fukuoka DPRI
Landslide June 1999 Slide-debris flow induced by heavy rainstorm in Hiroshima, Japan Provided by Prof. Fukuoka DPRI
Landslide July 2004 slide-debris flow in Minamata induced by localized heavy rainstorm, Japan Provided by Prof. Fukuoka DPRI
Feb 2006 Landslide at Ginsaugon, southern Phillippines induced by rainstorm and small earthquake Photo: U.S. Pacific Command web site http://www.pacom.mil/special/0602pimudslide/photos.shtml Death toll:154, missing:990 (National Disaster Coordination Center (NDCC)) Provided by Prof. Fukuoka DPRI
(After EQ, September 2, 2008) Shi_Chuan, CHINA Debris flow triggered by heavy rainstorm in September 2008 Source (After Rainstorm, December 3, 2008) Provided by Prof. Fukuoka DPRI
Planning phase Preparing Phase Urgent Phase (year to decades) (1day~1 week) (less than 1 day) Different time phases toward the mitigation Construction Standards Construction of Defence Evacuation Planning Disaster Map Tentative Reinforcement Stop constructing Work Large scale evacuation Evac. of aged or HCman Warnings, Alerts Monitoring Evacuation Etc. Decision Maker Hazards Interpretation Understandable Information Meteorology Observation (Now-casting). Numerical Prediction Climatological statistics
Preparing Phase Urgent Phase (1day~1 week) (less than 1 day) Importance of Information Transfer Decision Maker Responsible Authority Individual Citizen Evacuation etc. SpecializedInformation GeneralInformation Observation (Now-casting). Numerical Prediction Climatological statistics
Example of Statement In this symposium it is recognized that the implementation of state-of-the-art weather radar technology and numerical prediction is essential for reducing the impact of severe weather hazards. The participants of this symposium agree to enhance mutual cooperation and exchange of experience and knowledge toward sustainable capacity building and the prevention and mitigation of weather related disasters.