Download

1 / 7
80 likes | 321 Vues
Yr 11 Population revision. LO: To understand how population pyramids show population structures in MEDCs and LEDCs. Learning Outcomes:. You must describe a population pyramids structure, suggesting what it shows (E)

E N D
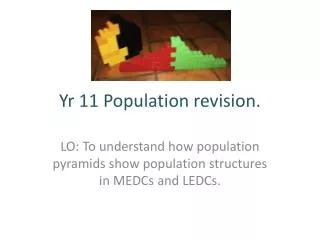
Yr 11 Population revision. LO: To understand how population pyramids show population structures in MEDCs and LEDCs.
Learning Outcomes: You must describe a population pyramids structure, suggesting what it shows (E) You should describe population pyramid structures and link these to birth rates and death rates, suggesting basic links to development (C) You could link the structure of population pyramids to economic development, giving specific examples, and using key words (A/A*)
Population pyramids: • Population pyramids can tell us a lot about the structure of a population. • They can tell us the birth rate, the death rate, the number of old people, the number of young people etc. • Think: Which of these 2 countries has a higher death rate? Explain your answer. A. B.
LEDC/MEDC • Population pyramids can also tell us how developed a country is. Why? • Think: Which of these 2 pyramids is an LEDC, and which is an MEDC? Explain.
Things to consider: Are they LEDC/MEDC, high BR/DR, lots of elderly/young dependents? Task 1: Be ready to present your models! • Group A: With your Lego, create a population pyramid to show the structure of the population in Kenya. • Group B: With your Lego, create a population pyramid to show the structure of the population in Japan. • Group C: With your Lego, create a population pyramid to show the structure of the population in India. • Group D: With your Lego, create a population pyramid to show the structure of the population in Australia.
Task 2: • Using the Lego provided – create a general population pyramid for an LEDC and a general population pyramid for an MEDC. • Once you have created these – copy their shapes into your books; and explain their shape. Make reference to key words such as: birth rate, death rate, healthcare, education.
Finally: 10 minutes to write down some ideas… • How can population pyramids change over time? • How do birth rate, death rate, the number of elderly dependents and the number of young dependents, show how developed a country is?