Download
1 / 44
440 likes | 1.52k Vues
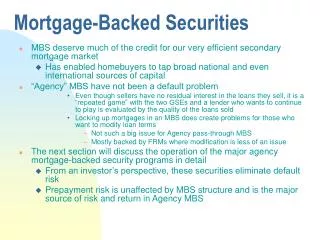
How Resilient Are Mortgage Backed Securities to Collateralized Debt Obligation Market Disruptions? Joseph R. Mason, Associate Professor of Finance, Drexel University Joshua Rosner, Managing Director, Graham Fisher & Co. Figure 1: U.S. Home Ownership 1965-2006 Source : Bureau of Census

E N D
How Resilient Are Mortgage Backed Securities to Collateralized Debt Obligation Market Disruptions? Joseph R. Mason, Associate Professor of Finance, Drexel University Joshua Rosner, Managing Director, Graham Fisher & Co. Criterion Economics L.L.C.
Figure 1: U.S. Home Ownership 1965-2006 Source: Bureau of Census Criterion Economics L.L.C.
Figure 2: Home Equity Extracted and Available for Extraction 1995-2005 Source: Joint Center for Housing Studies of Harvard University (2006). Criterion Economics L.L.C.
Figure 3: Refinancing Behavior 1995-2005 Sources: Joint Center for Housing Studies of Harvard University (2006). Criterion Economics L.L.C.
Figure 4: Piggyback Lending for Home Purchase 2001-2004 Source: SMR Research Corporation (2004). Criterion Economics L.L.C.
Figure 5A: Investment Homes Share of Total Homes Purchased Source: National Association of Realtors Criterion Economics L.L.C.
Figure 5B: Prime Market Investor Shares Source: Harvard’s Joint Center for Housing Studies (2006) Criterion Economics L.L.C.
Figure 6: Five Year BBB- Floating Home Equity Spread to One-Month Source: Bureau of Census Criterion Economics L.L.C.
The Complexity of Securitization • Mortgages and Mortgage-backed Securities Are Complex and Difficult to Value • Complexity of Default vs Prepay Risk • Additional Complexity in MBS • Deep Tranching • Unique Securities • Examples Criterion Economics L.L.C.
The Complexity of Securitization • Mortgages and Mortgage-backed Securities Are Complex and Difficult to Value • Complexity of Default vs Prepay Risk • Additional Complexity in MBS • Deep Tranching • Unique Securities • Examples Criterion Economics L.L.C.
Default Models are Well-accepted Throughout the Mortgage Industry Criterion Economics L.L.C.
Figure 7: Prepayment and Default Rates as a Function of Mortgage Duration Source: Calomiris and Mason (2007). Criterion Economics L.L.C.
Typically Adjust for Prepayment Speeds with PSA Models Prepayment and Principal and Interest Cash flows arising from Selected Prepayment Scenarios Source: Mathworks.com Criterion Economics L.L.C.
Table 1: Regression Results (Dependent Variable Is Prepayments) Source: Calomiris and Mason (2007) Criterion Economics L.L.C.
The Complexity of Securitization • Mortgages and Mortgage-backed Securities Are Complex and Difficult to Value • Complexity of Default vs Prepay Risk • Additional Complexity in MBS • Deep Tranching • Unique Securities • Examples Criterion Economics L.L.C.
Figure 8: Tranches Issued in European Securitizations 1987-2003 Source: Firla-Cuchra and Jenkinson (2005) Criterion Economics L.L.C.
Table 2: Issues with the Given Number of Tranches as a Percentage of All Issues Per Type (Mean Number of Tranches Per Issue) Source: Firla-Cuchra and Jenkinson (2005) Criterion Economics L.L.C.
The Complexity of Securitization • Mortgages and Mortgage-backed Securities Are Complex and Difficult to Value • Complexity of Default vs Prepay Risk • Additional Complexity in MBS • Deep Tranching • Unique Securities • Examples Criterion Economics L.L.C.
The Complexity of Securitization • Mortgages and Mortgage-backed Securities Are Complex and Difficult to Value • Complexity of Default vs Prepay Risk • Additional Complexity in MBS • Deep Tranching • Unique Securities • Examples Criterion Economics L.L.C.
Figure 9: Examples of Actual MBS Funding Structures Source: ABSnet Criterion Economics L.L.C.
The Complexity of Securitization • Point: Mortgages are complex and difficult to value, and MBS are built upon that complexity. • Fundamental changes to underwriting and servicing standards are not easily identifiable in the inherent complexity of mortgages and MBS, posing risk to mortgage funding. Criterion Economics L.L.C.
CDOs Add Complexity to MBS and Other Constituent Credit Instruments • Complexity of CDO Structures • Growth of the CDO Market Criterion Economics L.L.C.
Figure 10: Basic CDO Security Structure Source: JP Morgan, CDO Handbook 5 (2001). Criterion Economics L.L.C.
Figure 11: Typical Tranche Sizes and Coupon Rates Source: Lucas, Goodman and Fabozzi (2005) Criterion Economics L.L.C.
Key Differences between MBS and CDOs • CDO pools are actively managed. • CDO transactions close before the pool of underlying assets is fully formed. • CDOs are heterogeneous with respect to granularity. • CDOs illustrate more ratings volatility than ABS or MBS. • CDO collateral heterogeneity increases opacity. • Secondary market trading (liquidity) is limited. Criterion Economics L.L.C.
Figure 12: Examples of Actual CDO Funding Structures Source: Bennett and Mason (forthcoming 2007) Criterion Economics L.L.C.
CDOs Add Complexity to MBS and Other Constituent Credit Instruments • Complexity of CDO Structures • Growth of the CDO Market Criterion Economics L.L.C.
Figure 13: Annual Cash CDO Issuance Source: Lucas, Goodman, and Fabozzi (2006) Criterion Economics L.L.C.
Fast Growth: Lessons from 1999-2003 The CDO market is opportunistic in the way it drops collateral types that are out of favor with investors and picks up collateral types that are in favor with investors. The best example of this is the switch out of poor-performing high-yield bonds and into well-performing high yield loans between 2001 and 2003. Also, certain types of ABS present in SF CDOs from 1999 through 2001 disappeared from later vintages: manufactured housing loans, aircraft leases, franchise business loans, and 12b-1 mutual fund fees. All of these assets had horrible performance in older SF CDOs. In their place, SF CDOs have recently focused more on RMBS and CMBS. (Lucas, Goodman and Fabozzi 2006, at 5). Criterion Economics L.L.C.
The Link from Mortgages to Mortgage-Backed Securities to Collateralized Debt Obligations • CDO rating changes follow other ratings changes. • An extremely high proportion of current CDO collateral is MBS. • 1999-2003 redux? Criterion Economics L.L.C.
Figure 14: Number of CDO, RMBS, and ABS Ratings Changes, Three-month MA Criterion Economics L.L.C.
The Link from Mortgages to Mortgage-Backed Securities to Collateralized Debt Obligations • CDO rating changes follow other ratings changes. • An extremely high proportion of current CDO collateral is MBS. • 1999-2003 redux? Criterion Economics L.L.C.
How much and what kind of MBS are in CDOs? • The FDIC reports that 81 percent of the $249 billion of CDO collateral pools issued in 2005, or $200 billion, was made up of residential mortgage products. (FDIC Outlook, Fall 2006) Criterion Economics L.L.C.
How much and what kind of MBS are in CDOs? • The FDIC reports that 81 percent of the $249 billion of CDO collateral pools issued in 2005, or $200 billion, was made up of residential mortgage products. (FDIC Outlook, Fall 2006) • Moody’s reports that among RMBS, 70%-75% below AAA-rated Table 3: Top Collateral Types in Resecuritization CDOs, 2005 (All Vintages) Criterion Economics L.L.C.
How much and what kind of MBS are in CDOs? • The FDIC reports that 81 percent of the $249 billion of CDO collateral pools issued in 2005, or $200 billion, was made up of residential mortgage products. (FDIC Outlook, Fall 2006) • Moody’s reports that among RMBS in CDOs, 70%-75% below AAA-rated. (Moody’s CDO Asset Exposure Report, October 2006) • $200 billion of RMBS in CDOs x 70% below AAA = $140 billion of lower-tranche RMBS in CDOs Criterion Economics L.L.C.
How much and what kind of MBS are in CDOs? • The FDIC reports that 81 percent of the $249 billion of CDO collateral pools issued in 2005, or $200 billion, was made up of residential mortgage products. (FDIC Outlook, Fall 2006) • Moody’s reports that among RMBS in CDOs, 70%-75% below AAA-rated. (Moody’s CDO Asset Exposure Report, October 2006) • $200 billion of RMBS in CDOs x 70% below AAA = $140 billion of lower-tranche RMBS in CDOs • SIFMA puts total RMBS issued in 2005 at $1,326 billion. Criterion Economics L.L.C.
How much and what kind of MBS are in CDOs? • The FDIC reports that 81 percent of the $249 billion of CDO collateral pools issued in 2005, or $200 billion, was made up of residential mortgage products. (FDIC Outlook, Fall 2006) • Moody’s reports that among RMBS in CDOs, 70%-75% below AAA-rated. (Moody’s CDO Asset Exposure Report, October 2006) • $200 billion of RMBS in CDOs x 70% below AAA = $140 billion of lower-tranche RMBS in CDOs • SIFMA puts total RMBS issued in 2005 at $1,326 billion. • Assuming 90% AAA in all 2005 RMBS, that leaves a total of $133 billion in lower-tranche RMBS issued in 2005 Criterion Economics L.L.C.
The Link from Mortgages to Mortgage-Backed Securities to Collateralized Debt Obligations • CDO rating changes follow other ratings changes. • An extremely high proportion of current CDO collateral is MBS. • 1999-2003 redux? Criterion Economics L.L.C.
1999-2003 Redux (but with MBS)? • Point: CDOs are buying a lot of lower-tranche RMBS • Point Point: The 10% of lower-tranche RMBS provide crucial credit support for the 90% of AAA securities. • If you can’t sell the 10%, can’t sell the other 90%! • Point Point Point: If CDOs exit RMBS as they did with other collateral after 1999-2003, that will leave a substantial hole in the market for crucial lower-tranche RMBS. Criterion Economics L.L.C.
Table 5: CDO Risk Premiums and Credit Spreads and Macroeconomic Performance Source: D’Amato (2005) Criterion Economics L.L.C.
Figure 16: CDO Issuance and U.S. Home Equity ABS Indices Source: BIS Quarterly Review, Dec. 2006 Criterion Economics L.L.C.
Overview of Public Policy Implications: Information Problems across Financial Markets and Institutions CDO Market is here Want to move it this way Adapted from Merton, “A Functional Perspective of Financial Intermediation,” Financial Management, Summer 1995. Criterion Economics L.L.C.
Policy Implications • Transparency • Stability • Continued Innovation Criterion Economics L.L.C.
Policy Implications MBS Pioneer Lewis S. Ranieri, in an interview published in the American Banker last June, said: "When you start divorcing the creator of the risk from the ultimate holder of the risk, it becomes an issue of, 'Does the ultimate holder truly understand the nature of the risk that you've redistributed?' " Mr. Ranieri said. "By cutting it up in so many ways or complicating it by so many levels, do you still have clarity ... on the nature of the underlying risk?" "It's not clear that we haven't gone, in some ways, too far -- that we have not gone beyond the ability to have true transparency," he said. "That is a fair question many of us in the business and people in the regulatory regime are wrestling with." Criterion Economics L.L.C.