Download
1 / 83
880 likes | 1.56k Vues
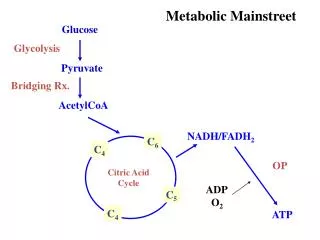
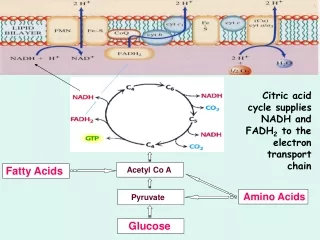
Glucose Monitors and Glucose Sensing. Applications for the 21 st Century and Beyond The Quest for the Closed Loop. Why Glucose Sensing??. More “real time” assessment Ability to detect hypoglycemia and hyperglycemia at “odd” times

E N D
Glucose Monitors and Glucose Sensing Applications for the 21st Century and Beyond The Quest for the Closed Loop
Why Glucose Sensing?? • More “real time” assessment • Ability to detect hypoglycemia and hyperglycemia at “odd” times • Better administration and correlation of insulin dosages—less guessing • May uncover eating disorders and other issues related to stress, diet and exercise • Patient compliance with monitoring an issue– many do not like to “poke” fingers or other sites so often. Pain and discomfort, lack of blood obtained, lost strips, etc.
Why Glucose Sensing?? • Goal– Closing the Loop • An artificial pancreas • Provide accurate and specific data to control glucose levels – many individuals keep blood glucoses higher than optimal to avoid hypoglycemia • Fear of hypoglycemia in the middle of the night– not waking up • “Take the worry” out of diabetes treatment – Type 1 patients in particular; parents, children and physicians
Optimal Conditions for Glucose Measurement • Immediate availability of results and measurements • High frequency of measurements • Measurements every 2-5 minutes would be ideal • Ability to detect rapid rise or decline is necessity • Need quick signal stability after initiation or placement • Stability over prolonged period of time (>3 days necessary)
Case for Glucose Sensing – Recent Studies • 23 patients participated – hospitalized and ambulatory • Both Type 1 and Type 2 individuals • Study lasted 72 hours (key time limit) • 75 capillary samples were obtained • Microdialysis subcutaneous monitoring system used • microdialysis catheter; extracorporeal electrochemical sensor • signal needed to be corrected for fluid transportation – 31 minutes (lag time) Diabetes Care 24: 1696, 2001 Jungheim et al
Results of Study and Conclusions • Studies showed no limitations to patients activity and only mild skin irritation • Difference between SCGM and capillary glucose was ~ 7-9 % over the full range (meter differences can be as much as 10 – 15 %) • Hypoglycemia was detected with SCGM but was missed 58-71% of the time by spot capillary measurements. This despite 5-7 or more measurements per day • No decay in sensitivity over the 72 hour period • SCGM could be useful in glucose control & therapy
Glucose Monitor Development Race for the Closed Loop System, Painless, Continuous and the “Gold”
Types of Monitors in Development • Minimally invasive interstitial devices • Transcutaneous optical devices • Electrochemical sensing devices • subcutaneous • Implantable • Implantable optical sensors
Physiology of Interstitial Fluid • Extracellular fluid and flows through the capillary walls • Glucose levels in interstitial fluid ≠ blood glucose • Lag time could be ~ 10 to 20 minutes • Perspiration, oils and other environmental factors (lotions, etc.) can dilute the measurements and adversely affect the results as sample size is small
Interstitial Glucose Sensor Glucowatch Biographer 2 Cygnus Corp: www.glucowatch.com
Advantages and Limitations of Glucowatch System Non-invasive Detects trends and patterns in glucose levels readings every 10 minutes with up to 6/hour = 72 readings/monitoring session Alerts patients to rapids changes in glucose levels Less painful?? Computer download capable ? Ability to determine insulin or medication adjustmens 2 hour “warm-upperiod Calibration is needed with each sensor use Skin irritation with sensor and adhesive Skipped readings possible with rapid changes in temperature, perspiration and if system is bumped or dislodged If several readings in a row are skipped, the system must be recalibrated Advantages Limitations
Use of Glucowatch Biographer 2 • Intended for use in adults and children to detect trends and patterns in glucose levels • To detect and assess hyperglycemic and hypoglycemic patterns to help facilitate adjustments in therapy • To be used as an adjunctive device, to supplement, not replace, information obtained from traditional and standard home glucose monitoring devices!
Glucowatch Biographer 2 • Draws out interstitial fluid by reverse electroionophesis • Glucose interacts with Glucose Oxidase Membrane to form hydrogen peroxide which interacts with biosensor producing low electric current which is measured and analyzed • Glucowatch 2 • Cost $599 to $799 • Rebates can save $200 to $300 • Auto sensor • Disposable transdermal pad • Changed every 14-15 hours • ~$4 each (2 needed) for each recording session • Concerns with calibration time, risk of infection and irritation
CATHODE ANODE Cl-, (ascorbate, urate) Na+, neutral species (i.e., glucose) Glucose Collection with the GlucoWatch®G2™ Biographer Uses Reverse Iontophoresis • Only small compounds pass through the skin. • No proteins (e.g., hemoglobin) in the extract • Glucose is collected at the cathode. • Interfering species (ascorbate and urate) collected at anode • The charge and size exclusion properties of reverse iontophoretic extraction will lead to a very “clean” sample. Data on file, Cygnus Inc. 2002.
† 3 min ‡ 7 min † 3 min ‡ 7 min † 3 min ‡ 7 min † 3 min ‡ 7 min The Automatic Monitoring Process with the GlucoWatch®G2™ Biographer * A “RUNNING AVERAGE” PROVIDES READINGS EVERY 10 MINUTES Internal measure 127 mg/dL 109 mg/dL 101 mg/dL 112 mg/dL Displayed reading 118 mg/dL 105 mg/dL 107 mg/dL TIME 3:10 pm 3:20 pm 3:30 pm 3:40 pm * Following a 2 hour warm-up and calibration † 3 min glucose collection ‡ 7 min glucose measurement Data on file, Cygnus Inc. 2002.
Biographer Readings 60% 34% 1% 4% 0.1% 2996 paired points ZONE A B C D E A 400 E C 350 300 250 B 200 Biographer Readings (mg/dL) 150 D D B 100 50 E C 0 0 100 200 300 400 One Touch® Profile® GlucoWatch® Biographer Home Study – Clarke Error Grid Analysis Slope = 0.95, Intercept = 12.6 mg/dL, r = 0.80 (A) Accurate. Biographer within 20% of finger-stick test result (or both below 70 mg/dL) (B) Acceptable. Difference greater than 20% but Biographer would not lead to bad decision (C) Might cause an over-correction of normal glucose levels. Finger-stick blood glucose test result in the normal range, but Biographer reading is high or low. (D) Failure to detect a high or low glucose level. Biographer reading in the normal range, but finger-stick blood glucose test result is high or low (E) Treatment error could occur. Biographer reading low when finger-stick blood glucose is high or Biographer reading high when finger-stick is low. One Touch® Profile® * Glucose Readings (mg/dL) * One Touch® Profile® – Johnson and Johnson, New Brunswick New Jersey Data on file, Cygnus Inc. 2002.
Studies of Glucowatch vs. Meters • Differences between interstitial fluid and blood glucose • Time lag: 17.2 minutes ± 7 minutes with Glucowatch • Time lag: 13 minutes with most blood glucose meters • With glucose increasing, changes were less as measured by Glucowatch as compared with blood • With glucose decreasing, changes were greater as measured by Glucowatch as compared with blood or meters • Conclusion: possible false hyperglycemia and false hypoglycemia if taken unilaterally Kulcu et al: ADA Meeting 2002
SpectRx Glucose Sensing System • Transdermal Biophotonic System • Fluid is collected through micropores • Laser system used on the outer layer of skin • Measured in a patch which contains a glucose sensor • Clinical trials are ongoing • Is not FDA approved at this time • Still similar to Glucowatch in that it provides information on trends and not necessarily real-time for treatment adjustments SpectRx website: www.spectrx.com
SpectRx Glucose Sensing System Laser device on the skin surface Patch with sensor system embedded www.spectrx.com
Preliminary data with SpectRx ISF System www.spectrx.com
Pendragon Glucose Sensing System • Uses electromagnetic waves • Attached to lower forearm similar to the Glucowatch • Performs measurements every minute but averaging occurs
Recent Study with PENDRA • 15 individuals without diabetes • Changes in microcirculation of the arms resulted in varying glucose values • Temperature changes, other environmental issues had to address via a complex calibration procedure • Conclusions: • Need to “fix” device appropriately to arm to avoid possible variations • Needs extensive physician and patient training to operate • Needs further studies prior to any extensive use in the clinical setting Diabetes Technology and Therapeutics 6:435, 2004
Electrochemical Glucose Sensors CGMS TGMS DexCOM
Continuous Glucose Monitoring System--CGMS • Basic Premise: Glucose + Oxygen = Gluconic Acid + H2O2 • Reaction is submitted to an electrical current which is proportional to the glucose concentration which is measured • Enzymatic or Electrochemical Sensors are implanted in the subcutaneous tissue (under the skin) • Similar to the catheters used in insulin pump therapy • Short term use at present; reliability just 48 to 72 hours
Medtronic (MiniMed) CGMS System Two Views of CGMS
Mechanism of Action of CGMS Enzymatic Reaction is measured by sensor in IF through skin
CGMS System • Sensor is percutaneous an ~1mm in diameter • Measures an “average” glucose value every 5 minutes and is stored in the monitor • “Hard” wired system; worn externally • Requires calibration at 4-5 times per day, otherwise data is not able to be downloaded • Able to enter events on the monitor to assist with interpretation of results • 3 day use only at this time • Not “real time”—requires return to physician office for download and interpretation
CGMS System • Problems with encapsulation tissue which can cause errors in data collection • Anything implanted in the body over time becomes covered with a protein layer initially and then a collagen like layer • Encapsulation tissue is to protect the body from foreign objects which may be perceived as harmful and to isolate the object chemically (ie.—broken port in pulmonary artery) • This chemical isolation could decrease the sensitivity and response time of electrochemical subcutaneous systems such as CGMS
Self monitoring of glucoses several times per day will leave “gaps”– large excursions can occur without patient knowledge Hypothesis: to test the reproducibility of the CGMS in “real-life setting” CGMS may be a tool that could alleviate this difficulty System measures glucose concentration every 5 minutes for a 72 hour period Preliminary Study– performed in Type 2 patients ~ 150 separate glucose tracings Included healthy volunteers and patients on only metformin Correlated with frequent blood glucose measurements Noted exceeding high incidence of hypoglycemic events with no symptoms and not confirmed by simultaneous blood glucose measurements Correlation coefficient –r=0.74 CGMS– Reproducibility StudyMetzger, M. et al: Diabetes Care 25:1185, July 2002
CGMS– Reproducibility StudyMetzger, M. et al: Diabetes Care 25:1185, July 2002 • “Real Life Study” was undertaken to determine accuracy and reproducibility of tracings utilizing the CGMS device • 11 patients involved in the study • 6 had Type 1 diabetes • 3 had Type 2 diabetes • 2 “healthy” volunteers with no history of DM • 10 male, 1 female • Placed on two glucose sensor devices simultaneously for a 3 day period with usual “normal” activity
CGMS– Reproducibility StudyMetzger, M. et al: Diabetes Care 25:1185, July 2002 • Protocol – Sensors were attached according to the manufacturer’s instructions • Sensors were placed in the abdominal SQ tissue 4-5 cm to the right or left of the umbilicus • Calibration and Initialization were performed and 1 hour was elapsed before first capillary glucose • Meal times were recorded • Capillary glucoses were done immediately post meals, during the night and early AM • Capillary glucoses were entered into the monitor within 5 minutes of determination
CGMS– Reproducibility StudyMetzger, M. et al: Diabetes Care 25:1185, July 2002EA • Download was done upon completion and analysis was performed immediately • Anonymity was preserved • Each day was divided into 8 time intervals according to the meal times of the patient • Classifications: • A: Satisfactory • B: if all glucose values are between 80 –150 • C: glucose > 150 during >1 hr., too low • D: glucose < 70 during >30 minutes or impossible to evaluate due to technical reasons
CGMS– Reproducibility StudyMetzger, M. et al: Diabetes Care 25:1185, July 2002 • D Classification was further subclassified: • D1: Low concordance between sensor and glucometer r < 0.8 or the difference is too high (28%) • D2: Insufficient number of meter glucose values entered for calibration • D3: Strong midnight shift: usual sensor glucose values post midnight. Usually secondary to insufficient number of calibration values. • Evaluations were analyzed by two different observers independently and concordance rates were determined
CGMS– Reproducibility StudyMetzger, M. et al: Diabetes Care 25:1185, July 2002 • Mean sensor not recording glucose values • 46 classified in the “D” group and not use of sensor: 60.4 ± 16.9 hours each patient • 432 single time intervals were initially evaluated • 78 (18%) were discarded for technical reasons • 32 due to interpretable • 139 paired sets of data were available for sensor-sensor comparison. • 92 from Type 1 patients • 30 from Type 2 patients • 17 from non-diabetes volunteers
CGMS– Reproducibility StudyMetzger, M. et al: Diabetes Care 25:1185, July 2002 • Concordance was seen in only 65% of the time periods • 25% noted glucose levels too high in one sensor and satisfactory in the other • 9% noted glucose levels too low with satisfactory levels in the other • 1 case noted: sensor 1 showed hyperglycemia, sensor 2 showed hypoglycemia • No difference between patients with DM and non DM
CGMS– Reproducibility StudyMetzger, M. et al: Diabetes Care 25:1185, July 2002 • Conclusions: • Accuracy and reproducibility is lower than previously thought • Differences were greatest between the 125 and 225 mg/dl range – most important area in treatment of patients with diabetes mellitus • Correlation between two simultaneous sensors was lower than that of capillary vs. sensor (r = 0.84 vs. 0.90)
CGMS– Reproducibility StudyMetzger, M. et al: Diabetes Care 25:1185, July 2002 • Conclusions: • 35% clinically important discrepancies between two simultaneous sensor tracings • Could result in incorrect clinical advice in 17% of patient cases • RESULTS OBTAINED IN “REAL LIFE” SITUATIONS MUST BE INTERPRETED IN INDIVIDUAL CLINICAL TERMS
CGMS– Reproducibility StudyMetzger, M. et al: Diabetes Care 25:1185, July 2002 • Development of a reliable device for continuous glucose monitoring is of outmost importance in the treatment of diabetes • Future endeavors in this area must be rigorously evaluated in “real life” situations before release to the general public • Rebuttal from Medtronic —concerns in the above study: software used was earlier version, device was used for more than planned or approved
Additional Studies--2003 • Armstrong and King: ADA Meeting 2003 • 11 subjects: 2 No Diabetes, 6 Type 1, 3 Type 2 • Measured Glucoses with 1 Touch Ultra 7 times per day • Wore 2 sensors (CGMS) concurrently for 3 days • Mean Sensor life: 67 hours • Used updated software • Found accuracy with newer software ~94% • Most of differences between modalities within 10% • Sensor-sensor differences less than previous study
Rebuttal to Metzger Findings • Expectations did not coincide with CGMS intended use • Study did not use Clarke error grid but was one of subjective assessment • Study did use updated software (Solutions 3.0) • Results are similar to those reported in the post-marketing studies (Diabetes Technology and Therapeutics, 2000) • CGMS is intended to “supplement, not replace, blood glucose information using standard monitoring devices” • CGMS, when used with home monitoring devices and HbA1C values can help optimize clinical management Mastrototaro and Gross; Diabetes Care 26:256 2003
Rebuttal to Metzger Findings • Solutions 3.0 software resolves most of the 18% rate of technical problems encountered in the study • Correction of the midnight shift • Improvement in the accuracy and reproducibility of the downloads • Improvement in the agreement between sensor and meter values Mastrototaro and Gross; Diabetes Care 26:256 2003
Rebuttal to Metzger Findings • CONCLUSIONS: • Results should be weighed against the encouraging results and conclusions from previous and evolving reports and research • ◙ Appears that this is a work in progress and should not be utilized as the sole clinical indicator! – should not be used at present as the only source for change in treatment regimens • -Speakers judgment after reviewing literature
Sample CGMS Reports Daily Report of Blood Glucoses
Sample CGMS Reports Modal Time Reports– Can be varied individually
Sample CGMS Reports Composite 3 day report for comparison
Additional Studies Involving Children • Accuracy of Glucowatch 2 system and CGMS in detecting hypoglycemia • Multi-center study • Involved the Children in Diabetes Research Network • 91 children enrolled • Ages 3-17 • Patients were enrolled in a CRC-clinical research center for 24 hours Diabetes Care 27:722-726 2004
Glucowatch 2 vs. CGMS • Patients used CGMS and Glucowatch 2 during each admission • 1/3 patients started CGMS 48 hours prior to admission • 1/3 patients started CGMS 24 hours prior to admission • 1/3 patients started CGMS on the day of admission • Each patient used 2 sensors for the G-watch 2 during the study– 2 hour overlap • 1 Touch Ultra meter used as calibration and control