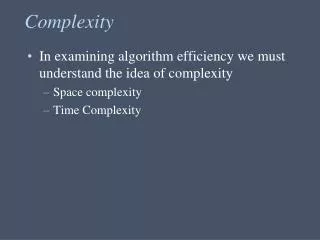
Dynamic Complexity
Dynamic Complexity. 50th Annual Meeting of the International Society for the Systems Sciences George P. Richardson Rockefeller College of Public Affairs and Policy University at Albany, SUNY. Learning in and about Complex Systems Sterman (1994). Unknown structure Dynamic complexity

Dynamic Complexity
E N D
Presentation Transcript
Dynamic Complexity 50th Annual Meeting of the International Society for the Systems Sciences George P. Richardson Rockefeller College of Public Affairs and Policy University at Albany, SUNY
Learning in and about Complex Systems Sterman (1994) Unknown structure Dynamic complexity Time Delays Impossible experiments Real World Virtual World Known structure Variable Complexity Controlled Experiments Selected Missing Delayed Biased Ambiguous Implementation Game playing Inconsistency Short term Information Feedback Decisions Misperceptions Unscientific Biases Defensiveness Strategy, Structure, Decision Rules Mental Models Inability to infer dynamics from mental models
Changing over time Tightly coupled Governed by feedback Nonlinear: changing dominant structure History-dependent Self-organizing Adaptive Counterintuitive Policy resistant Characterized by tradeoffs Dynamic Complexity arises because systems are…
Thinking dynamically Move from events and decisions to patterns of continuous behavior over time and policy structure Thinking in circular causal / feedback patterns Self-reinforcing and self-balancing processes Compensating feedback structures and policy resistance Communicating complex nonlinear system structure Thinking in stocks and flows Accumulations are the resources and the pressures on policy Policies influence flows Modeling and simulation Accumulating (and remembering) complexity Rigorous (daunting) model evaluation processes Controlled experiments Reflection System Dynamics Contributions
The system dynamics modeling process Adapted from Saeed 1992
Six Traditions Contributing to the Evolution of Feedback Thought • Biology: math models • Econometrics • Engineering • Social Sciences • Biology: homeostasis • Logic • Two Threads of Feedback Thought • System dynamics arises in theservomechanisms thread • (the first four in this list)
Forrester’s Hierarchy of System Structure • Closed boundary around the system • Feedback loops as the basic structural elements within the boundary • Level [stock] variables representing accumulations within the feedback loops • Rate [flow] variables representing activity within the feedback loops • Goal • Observed condition • Detection of discrepancy • Action based on discrepancy
The Endogenous Point of View • The closed causal boundary takes top billing • Dynamics arise from interactions within that boundary • Systems thinking is the mental effort to uncover endogenous sources of system behavior.
Global Average Temperature(Reconstruction 1400-1980; Data 1902-1998)
Stocks and flows help to explain self-reported drug use data
? ‘Challenging the clouds’ in a study of leasing in the automobile industry “We’re not in the used car business!”
Intuitive view of effect of leasing on auto sales: Leased car pipeline
Stocks and Flows in Global Warming Thought experiment:
But although the stock-and-flow insight holds, global climate is of course much more complex than that. And still much more complex than this simple global climate model, as well!
Feedback Thinking “For one good deed leads to another good deed, and one transgression leads to another transgression.” (Pirke Avot)
A Classic Reinforcing Loop(Myrdal 1944, Merton 1948) Prejudice against the minority group Majority’s perception of the inferiority of the minority Economic and educational discrimination against the minority (R) Achievements of the minority group
Structure and Dynamics of Terrorist Cells (R) Interfering with terrorist funding Terrorist funding Peripheral support for terrorists (B) Efforts to suppress terrorists (R) Terrorist actions (B) (B) (R) Recruiting terrorists Terrorist group Losing terrorists (R) (B) Terrorist zeal (R) (R) Terrorist martyrs to the cause
Insights about building teamwork in a public school Teamwork and Communication are self-reinforcing
Isolation of teams and punishing risk-taking inhibit the growth of trust
But longterm experience with teamwork can build communication
Risk taking can enhance effectiveness, which can build trust
A team-player culture is self-reinforcing: an opportunity or a trap
The Problem: 1996 U.S. welfare reform • Since 1930, a guarantee of lifetime Federal support • 1996 legislation ended that: • Temporary Assistance for Needy Families - TANF • At most five years of Federal support in one’s lifetime • The clock started for everyone on TANF in 1997 • People began timing out in 2002 • Financial burden will begin shifting to the states and counties • A series of facilitated group modeling efforts in three New York State counties tried to help counties cope. Where are the leverage points?
Three Policy Mixes • Base run (for comparison) • Flat unemployment rate • Historical client behaviors • Investments in the “Middle” • Additional services to TANF families • Increased TANF assessment & monitoring • Safety net assessment & job services • Investments on the “Edges” • Prevention • Child support enforcement • Self-sufficiency promotion
Base, “Edges,” and “Middle” Compared:Populations on the Welfare Rolls “Edges” looks better.
Total Job-Finding Flows from TANF “Middle” looks better.
Program Expenditures “Edges” looks worse, then better.
Populations in the Welfare System “Middle” looks worse than “Base”! “Edges” looks much better.
Total Recidivism Flows (back to TANF) The hint for understanding the puzzling dynamics: recidivism.
Behavior of the Archetype in response to increased TANF support capacity Total families at risk Families on TANF Post-TANF employed
The Behavior of the Archetype • Families on TANF initially declines, as more support hastens job finding. • Post-TANF families employed initially increases, just as policy makers would predict. • Eventually (it takes a year and a half to begin to see it), … • Families on TANF rises higher to a new high, • Post-TANF Employed declines to a new low, • And Total Families at Risk rises! • …All because of increased TANF support capacity!
Why? • Increasing TANF support • Speeds job finding, • Swamping downstream Post-TANF jobs and support