precipitation
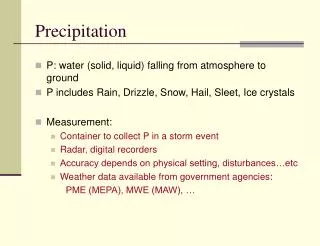
Precipitation. Single strongest variable driving hydrologic processesFormed water vapor in the atmosphereAs air cools its ability to

precipitation
E N D
Presentation Transcript
1. Precipitation Chapter 2
4. Weather Patterns Weather (day to day) vs. climate (years-decades and patterns)
What are hydrologists most concerned with?
Climate and geography result in biome classification
8. Figure 2.4-where does the moisture come from
Why does ohio get steady rainfall-fronts and convection
Compare to other areas in US
Figure 2.4-where does the moisture come from
Why does ohio get steady rainfall-fronts and convection
Compare to other areas in US
9. Figure 2.6
Have students explain differences in precip due to air masses
Rainfall typeFigure 2.6
Have students explain differences in precip due to air masses
Rainfall type
10. Measurement of Precipitation Terminology (2.3)
Types of devices (2.4.2)
Snowfall conversions (2.4.1)
Location of devices (2.4)
Interpretation of data (2.3.3, 2.6)
11. Rainfall Terminology Type-hail, rain, snow, sleet
Depth
Storm Duration
Average rate of precipitation-Intensity
Return Period or Recurrence Interval
13. Snow Measurement Determine the water equivalent
5%-60% of snow depth may be water equivalent-- �density�
Snow pillows use antifreeze solution and pressure measurement to measure water equivalent
14. Location of Gages Gauges measure point rainfall
True precipitation unaffected by surroundings-winds, trees, buildings
Clearance distance 2 times height of object
For large areas multiple gauges are needed for more accurate estimates
16. Figure 2.9-error with gagesFigure 2.9-error with gages
17. Interpretation of Data Time distributions
Area distributions
Using point data to find average rainfall
Thiessen method
19. Figure 2.15
Figure 2.15
20. Figure 2.15
Figure 2.15
21. Figure 2.15
Figure 2.15
22. Figure 2.15
After summing areas and rainfall Thiessen predicts 2.08 inches, and the mean is 1.97 inches. This is because the heavier rainfall amounts in center of study area get more carry more area and weight in the calculation.Figure 2.15
After summing areas and rainfall Thiessen predicts 2.08 inches, and the mean is 1.97 inches. This is because the heavier rainfall amounts in center of study area get more carry more area and weight in the calculation.
23. Prediction-Frequency Distributions To plan and design projects must be able to predict probability of rainfall events
Duration, Intensity, Return Period
Often must estimate Return Periods
Use Hazen method to develop intensity-duration-frequency curve (Example 2.5).