Download
1 / 24
240 likes | 361 Vues
This paper presents an innovative approach to generate Origin-Destination (OD) tables using a disaggregated Traffic Analysis Zone (TAZ) structure for land development programs. The study highlights the inadequacy of aggregated TAZ systems in regional planning models and proposes a method that maximizes flexibility and efficiency in traffic pattern analysis. By breaking down TAZs into smaller zones, we can perform more accurate trip generation and distribution analyses, ultimately improving the planning process for various land use scenarios, including retail components and parking requirements.

E N D
Generating an OD Table with Disaggregated Zone Structure for Land Development Program 12th TRB National Planning Application Conference Xiaobo Liu, Ph.D. Adam Lanigan John Pavlovich, P.E. Jacobs Engineering Group 299 Madison Ave Morristown, NJ 07962
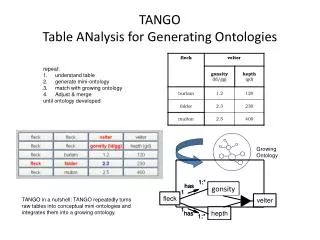
Introduction • The aggregated TAZ structure in regional planning models cannot provide adequate information for land development planning applications • How to employ detailed trip generation to create an OD table in the land development area while maximizing flexibility and efficiency for planning analysis? • The paper presents a simple, effective and efficient approach to investigate the traffic patterns with more accuracy
Determining TAZ Structure • Maximizing disaggregation of the TAZ structure would provide the most detailed information for planning purposes and traffic operational analysis • The disaggregated zones could be grouped into different sectors/blocks for trip generation to fit the land development programs • This could improve the flexibility and efficiency of updating the different elements during the planning procedure, such as updating the type and intensity of land development, various access plans, and geometric layouts
Proposed Procedure Trip Generation - block based Converting Block to “Zone” Structure Disaggregated P/A Assignment Normalization Land Development Program - block based Setup Disaggregated “Zone” Structure I-I Distribution I-E /E-I Distribution Traffic Directional Distribution Regional Demand Model E-E Distribution O-D Table
RIVER BEND DEVELOPMENT PLAN • Issues: • Assess Multiple • Development Scenarios
RIVER BEND DEVELOPMENT PLAN • Issues: • Assess Multiple • Development Scenarios • Formulate Multi-Phase Land • Use Mix
RIVER BEND DEVELOPMENT PLAN • Issues: • Assess Multiple • Development Scenarios • Formulate Multi-Phase Land • Use Mix • Maximize Retail Component
RIVER BEND DEVELOPMENT PLAN • Issues: • Assess Multiple • Development Scenarios • Formulate Multi-Phase Land • Use Mix • Maximize Retail Component • Minimize Parking • Requirements
RIVER BEND DEVELOPMENT PLAN • Issues: • Assess Multiple • Development Scenarios • Formulate Multi-Phase Land • Use Mix • Maximize Retail Component • Minimize Parking • Fast Track analysis
RIVER BEND DEVELOPMENT PLAN • Issues: • Assess Multiple • Development Scenarios • Formulate Multi-Phase Land • Use Mix • Maximize Retail Component • Minimize Parking • Fast Track analysis • Set Final Street Network
Conventional Approach • Shortcomings: • No O-D Table • Lack of I-I trip generation that could be essential for urban area • Analyzing alternatives requires manual adjustments and traffic • assignment: time consuming, labor intensive, and error prone
Land Development Program • Development area consists of 12 blocks (A-L) based on roadway boundaries • Each block has different land use plan • Land development program including the size of the development and land use, was changed frequently by developer to achieve max marketing • Roadway access was also updated over several iterations to provide best access to the site • 32 zones proposed in the study area, including 2 external zones and 30 internal zones.
Production/Attraction Assignment • Obtain trip productions and attractions for the land development area from ITE Trip Generation Manual • Breakdown block-based Productions/Attractions into zone-based
Internal-External External-Internal Distribution • The proportion of the total trips generated from internal zones to external zones (and external to internal) could be determined from a regional demand model or local knowledge of the development area • Include pass-by trips to the development zones in the O-D distribution
Internal-Internal Distribution • Production trips are used as the base • I-I trips are distributed using a gravity model based on the internal zone activity (multiply or add weight)
External-External Distribution • Determine the distribution of external zone to external zone traffic from a regional demand model • Credit the pass-by trips to the development zones credited from the E-E trips
Total Vehicle Trips EXAMPLE: TOTAL TRIPS 100 LESS TRANSIT ADJUSTMENT 15 NET TOTAL TRIPS 85 LESS INTERNAL/INTERNAL TRIPS 18 EXTERNAL/EXTERNAL PASS BY TRIPS 27 NET NEW VEHICLE TRIPS GENERATED 40
Results • Phased Land Use Development Program by Block • Sizing of Parking Facilities • Fast-tracking of Street Infrastructure • Ability to Evaluate Changes in Land Use Elements to Respond to Economic Conditions
Questions? Contact: John Pavlovich – john.pavlovich@jacobs.com Adam Lanigan – adam.lanigan@jacobs.com Xiaobo Liu – xiaobo.liu@jacobs.com