Download
1 / 25
250 likes | 364 Vues
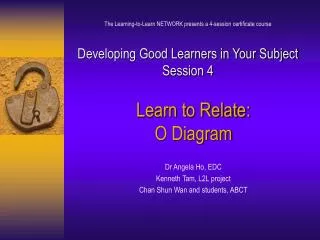
The Learning-to-Learn NETWORK presents a 4-session certificate course Developing Good Learners in Your Subject Session 4. Learn to Relate: O Diagram Dr Angela Ho, EDC Kenneth Tam, L2L project Chan Shun Wan and students, ABCT. UGC funded teaching development project Learning to Learn.

E N D
The Learning-to-Learn NETWORK presents a 4-session certificate courseDeveloping Good Learners in Your SubjectSession 4 Learn to Relate: O Diagram Dr Angela Ho, EDC Kenneth Tam, L2L project Chan Shun Wan and students, ABCT
UGC funded teaching development projectLearning to Learn Developing students’Cognitive, Motivational & Interpersonal strategies for learning
ITC LSGI ME ISE OR Participating departments • BSE • BUSS • COMP • EDC • ENGL • GEC
This session… • Are students learning effectively in laboratory work? (group activity) • O diagram – main features • Possible positive impacts (group activity) • Implementing O-diagram • Chan Shun Wan and his students
Structure of the O-Diagram • Inside • Knowledge / theories / concepts / reasons • Outside • Procedures / actions / objectives and conclusions • Divided into quarters representing various stages of an experiment / research • Stages are laid anti-clockwise around the circle
Using the O diagram • How to use? • Fill in each part with relevant information • Link information on the two sides of the O • Variations • Sequence: in-out, out-in, simultaneous • Amount of help provided
Understanding of material Bridging theory and practice Holistic picture of the experiment Transferable concepts from O diagram Insights into the nature of research: Relationship between hypothesis and conclusion Guided by objectives Research evolved around theories Pursuit of knowledge should have no end Positive Outcomes Expectable
Understanding of Material • … I think when you do this O diagram, if you don’t understand the lab, you wouldn’t be able to do it… (B:107) • Yes. As mentioned earlier, it shows the relationships and you understand it. This format helps you remember. So it helps you learn… (B:125) Back
Bridging theory and practice • “This is only one thing. Sometimes I learn a theory but don’t know how it can be applied, say in the experiment. This helps me in that it shows me say this is related that theory I’ve learnt earlier. But the old ones, for which I have to regurgitate tens of pages, I really don’t see how one thing relates to another.” (A:301) Back
Holistic picture of the experiment • … Doing this O diagram has already helped you achieve this, which shows you that the holistic picture of the experiment, a picture that we are often unable to give in our reports... A merit of this O diagram is this, that it shows the whole picture at a glance. (B:192) Back
Transferable concepts from O diagram • …we had a talk of career development today, I think we could use this to show ourselves [our career plan]. For example, if I wanted to open a bookshop in ten years, then I needed to find a job that would give me the money I needed. I could use this O diagram method, like set the goal in this space for hypothesis, then the procedures etc. I could use it for an evaluation. “Am I achieving my goals after one year?” It could be used this way, may be. (B:173) Back
Insights into the nature of research • Relationship between hypothesis and conclusion • I realise that the conclusion has to correspond to the aim... As it comes back to here, you can compare the hypothesis with the conclusion, and they should say similar things. In normal reports, where the conclusion is at the end, you wouldn’t try to match it with the aims. So I think now that doing an experiment, whatever results you get, the conclusion should be answering the aim or hypothesis. (B:154) Back
Insights into the nature of research • Guided by objectives • As mentioned earlier, you need to set the goal first, and everything you do is guided by that goal. That’s something learnt from the O diagram too. (B:158) Back
Insights into the nature of research • Research evolved around theories • Doing a research is to design a set of procedure based on what you’ve learnt. It’s the other way round for the O diagram, where you write the procedure and knowledge and link them together. Turning it around you get a research. (A:177) Back
Next… • Implementing O-diagram • Chan Shun Wan and his students, ABCT • Are students learning effectively in laboratory work? (group activity) • O diagram – main features • Possible positive impacts (group activity)
Developing Good Learners in Your Subject Session 4: Learn to Relate:Using O-diagram in the Laboratory Report of Pharmacology & Toxicology By CHAN Shun Wan February 2003
Why Use O-diagram? • Students easily forget basic knowledge related to the subject. • They find it hard to see the relationship between theories learnt, experimental design and procedures. • They usually produce a lengthy report instead of a precise one. • Most of the reports do not show a high level of understanding.
Purposes of Using O-diagram • Help students recall basic knowledge related to the subject. • Facilitate students to see the relationship between theories, experimental design and procedures. • They could produce good reports later. • Reduce students’ workload but ensure they have learnt. • O-diagram can easily fit into my existing curriculum.
Sample O-Report Format • Instructions for students: • Inside the circle are all theories and key concepts relevant to this experiment work in pairs. • Work anti-clockwise through the circle, from hypothesis to conclusion. • Fill in antagonist (A), agonist (B) and the biological response you have chosen. • After the experiment, record on the outside of the circle the steps you’ve taken and write the reason for each step inside the circle, adjacent to the steps. If a reason is already in the circle, draw a line to link the step to it.
Comparison of Report Format Good formal report
Students’ Response Negative points • The instruction is not clear • Not enough space to write Positive points • Understand the experiment better • Easy to do and save time • Catch key theories • Recall theories learnt in lecture
Teachers’ Observations • Students need to adapt to the new arrangement. • Students play an active part in learning. • Students have a better understanding of what they are doing. • Students have a holistic view of the subject. • Students produce better reports in other subjects. I agree that O-report could help students achieve a higher level of understanding of the subject matter.