Download
1 / 31
310 likes | 486 Vues
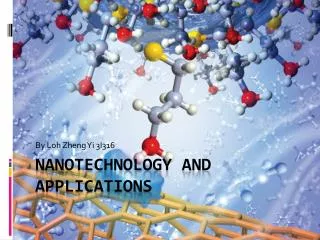
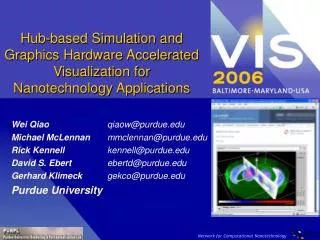
Hub-based Simulation and Graphics Hardware Accelerated Visualization for Nanotechnology Applications. Wei Qiao qiaow@purdue.edu Michael McLennan mmclennan@purdue.edu Rick Kennell kennell@purdue.edu David S. Ebert ebertd@purdue.edu Gerhard Klimeck gekco@purdue.edu

E N D
Hub-based Simulation and Graphics Hardware Accelerated Visualization for Nanotechnology Applications Wei Qiao qiaow@purdue.edu Michael McLennan mmclennan@purdue.edu Rick Kennell kennell@purdue.edu David S. Ebert ebertd@purdue.edu Gerhard Klimeck gekco@purdue.edu Purdue University
Our Goals • Provide advanced interactive visualization of scientific simulations to users worldwide without the user needing special graphics capabilities • Approach - integrate hardware-accelerated remote visualization into nanoHUB.org
Outline • nanoHUB.org • Challenges and requirements • Related work • Our system design • Performance and optimization • Case studies • Summary and future work
nanoHUB.org • A nano-science gateway for nanotechnology education and research • Created by the Network for Computational Nanotechnology (NCN) • Educational material • Animations • Courses • Seminars • Simulation tools accessible from a web browser
User Community and Usage • Nanoelectronics Community • Researchers • Educators • Students • Usage (last year) • More than 10,000 users viewed online materials • 1,800 users ran more than 54,000 simulation jobs consuming over 28,500 hours of CPU time
nanoHUB Simulation Architecture Open Science Grid and NSF TeraGrid Simulation Cluster Web Server Gig Net Internet Gig Net Virtual Machine
System Requirements • Transparency in service delivery • Scalability to increased workload • Responsiveness to user command • Flexibility in handling simulation data • Extensibility in software and hardware
Visualization Challenges • Architecture • Lack state of the art visualization systems • Mismatch between CPU and GPU resources • Users • Predominantly remote • Vast diversity of computing platforms and capabilities
Related Work • Molecular Dynamics Visualization • Surface rendering • Structure rendering • Volume visualization • Electron potential fields • Electronic wave function • Electro-magnetic fields
Related Work (Cont.) • Flow Visualization • Texture synthesis • CPU ([Wijk 91] and [Cabral and Leedom 93]) • GPU ([Heidrich et al. 99], [Jobard et al. 00], [Weiskopf et al. 2003] and [Telea and Wijk 03]) • Particle tracing • CPU ([Sadarjoen et al. 94]) • GPU ([Kolb et al. 04] and [Krüger et al. 05]) • Remote Visualization • Data is too large to transfer over network • Local workstation cannot handle the data • Distance collaboration
Practical Obstacles to nanoHUB • VNC session run on cluster nodes with no graphics hardware acceleration • Cluster nodes are rack mounted machines with neither AGP nor PCI Express interfaces • nanoHUB’s virtual machine layer cannot directly access graphics hardware
Our System Design • Client-server architecture • nanoVIS render server • Visualization engine library • Vector flows • Multivariate scalar fields • Rappture GUI client • User front end • nanoSCALE service daemon • Monitors render loads • Track GPU memory usage • Starts nanoVIS servers
Gig Net Client-Server Hardware-accelerated Render Farm Schematic View Open Science Grid and NSF TeraGrid Simulation Cluster Web Server Gig Net Internet Gig Net Virtual Machine
Hardware • Linux cluster render farm • 1.6GHz Pentium 4 • 512MB of RAM • nVIDIA Geforce 7800GT graphics hardware • Advantages • Extremely cost effective • Flexible to upgrade and expand • Integrates tightly into the nanoHUB architecture
Rappture Toolkit • Rapid Application Infrastructure Toolkit • Accelerate development of basic infrastructure • Declare simulator input / output using XML • Automatic generation of GUI
nanoVIS • Fully accelerated by graphics hardware • Visualize a variety of nanotechnology simulations • Volumetric and multivariate scalar fields • Texture-based volume visualization • FFC volume (zinc-blende) [Qiao et al. 2005] • Vector fields • GPU particle tracing • 2D texture synthesis • Geometric drawing to illustrate simulation geometry • GL primitive drawing
Particle Data Vector Field Pixel Shader GPU FBO Texture Vector Field Visualization (Cont.) • Particle Implementation • [Kolb et al. 2004] [Krüger et al. 2005] • Framebuffer Object (FBO) • Vertex Buffer Object (VBO) • Particles stay in GPU memory • 2D texture synthesis • Complement particles Vertex Data VBO Particle Render
Simulation Cluster Render Farm Rappture nanoSCALE Connect Data Connect Select Spawn Client-Server nanoVIS Client-Server Interaction
Performance and Optimization • Work load consideration • GPU heavy • Rendering • CPU light • Network communication • GPU-oriented optimization • GPU load estimation scheme • Node selection scheme based on estimated GPU load
Volume visualization Particle system GPU Load Estimation • Fragment processing cost • Number of rasterized fragments • Computation per fragment • Unified measurement for particle system and volume • Hard to compare cost of particle rendering to advection • Experimental data allows a unified measurement • Render cost is factor of 0.2 to advection • Estimation equation • Primary cost of the shader execution is texture access
Performance • Measure turn around time (from issue command to image received) • 128 x 128 x 128 scalar field • 512x512 render window • Simulated user interaction • Transfer function modification, rotation, zoom, cutting plane, etc.
Case Studies • Successfully developed several nanotechnology tools • SQUALID-2D • Quantum Dot Lab • BioMOCA • nanoWire
2-D Electron Gas Simulator • Goal • Study the effects of impurity in a nanowire • Device composition • Electrodes are positioned on the top • GaAs and AlGaAs semiconductor layers • A narrow channel constraining the electrons in the middle • Experiments • Vary magnetic field • Electron flows • Electron potential fields
2-D Electron Gas Simulator Flow and Electron Potential Particle Tracing and LIC
BioMOCA • Goal • Study the flow of ions through a pore in a cell membrane • Method • Compute random walks of ions through a channel with a fixed geometry within a cell membrane. Cell Wall Cell Wall
Quantum Dot Lab • Goal • Study the wave functions (orbitals) of electrons trapped in a quantum dot device • Method • Configure incidental light source, shape and size of the quantum dot s and p orbitals s orbital p orbital
Conclusions • Hub-based remote visualization is a powerful, flexible solution • Seamlessly delivers hardware-accelerated visualization to remote scientists with minimal requirements on their computing environments • Intuitive interface and ease of use are key for wide-usage • Enables rapid development and deployment of new simulation tools • Tight integration into the simulation and interactive performance can speed scientific discovery and change science work flow • nanoVis tools is huge success
Future Work • Expand to generic scientific hub-based visualization engine • Our system can be adopted to economically deliver accelerated graphics to other hub-based multi-user environments • Expand to large data support • GPGPU nano-electronics simulations and integrated visualization • More accurate GPU load estimation using nVidia newly released NVPerfKit 2.1 for Linux
Acknowledgement • Martin Kraus, Nikolai Svakhine, Ross Maciejewski, Xiaoyu Li • Anonymous reviewers for many helpful discussions and comments • nVIDIA • National Science Foundation under Grant No. EEC-0228390