3.1 Inequalities and their Graphs
130 likes | 327 Vues
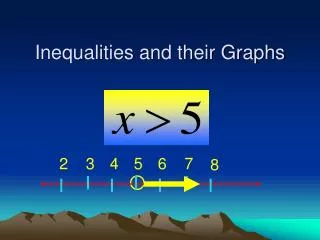
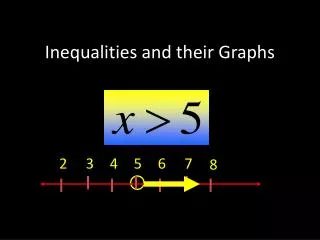
3.1 Inequalities and their Graphs. SWBAT identify solutions of inequalities. SWBAT graph and write inequalities in one variable. Warm Up. Draw a number line from -5 to 5. Graph the following numbers on the number line. 4 -3 ½ 0. Inequality Symbols.

3.1 Inequalities and their Graphs
E N D
Presentation Transcript
3.1 Inequalities and their Graphs SWBAT identify solutions of inequalities. SWBAT graph and write inequalities in one variable.
Warm Up • Draw a number line from -5 to 5. • Graph the following numbers on the number line. • 4 • -3 • ½ • 0
Inequality Symbols • Inequality symbols compare two numbers on a number line. • > means “strictly greater than” • Examples: 3 > 1 and 100 > 99 • < means “strictly less than” • Examples: 1 < 3 and 99 < 100 • > means “greater than or equal to” • Examples: 2 > -3 and 2 > 2 • < means “less than or equal to” • Examples: 5 < 10 and -3 < -3
Inequality: An equation that uses an inequality symbol instead of an equal sign. • Example: 2 < 4x • Solution of an inequality: Any number that makes the inequality true. • Example: • x < 3 • Solution: all real numbers less than 3
Examples • Is each number a solution of x< 7? • 9 • -1 • 14/2
Examples • Is each number a solution of x> 7? • -5 • -4.1 • 8 • 0
Sometimes you have to evaluate an expression to determine whether a value is a solution of an inequality. • Examples • Is each number a solution of 2 – 5x > 13? • 3 • -4 • Is each number a solution of 6x – 3 > 10? • 1 • 2 • 3 • 4
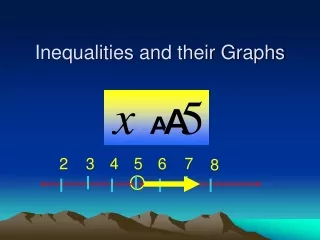
Graphing Inequalities • The solution of an inequality can be an infinite amount of numbers that would be impossible to write. • You can use a graph to indicate all of the solutions.
Open vs. Closed Circles • An open circle is used when you have a < or a > because the point is NOT a part of the solution. • A closed circle is used when you have a < or a > because the point IS part of the solution. • Examples: • x < 3 • m> -2
Graph Each Inequality • 1. c > -2 • 2. 4 <m • 3. a < 1 • 4. 2 > p
Write an Inequality for Each Graph • 1. • 2. • 3. • 4.