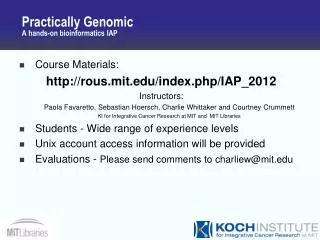
Hands-on session on Bioinformatics
Hands-on session on Bioinformatics. Alejandro Giorgetti Dept. of Biotechnology University of Verona http://molsim.sci.univr.it/bioinfo. Molecular system-level understanding.


Hands-on session on Bioinformatics
E N D
Presentation Transcript
Hands-on session onBioinformatics Alejandro Giorgetti Dept. of Biotechnology University of Verona http://molsim.sci.univr.it/bioinfo
Molecular system-level understanding • Small molecules control a myriad of cellular functions by binding to their target macromolecules: ligands govern processes such as growth, programmed cell death, sensing, and metabolism. This key event triggers complex cellular pathways characterized by reactions, environmental changes, intermolecular interactions, and allosteric modifications • Ultimately, understanding the molecular basis of ligand-target interactions requires the integration of biological complexes into cellular pathways: “systems biology” • All of these processes involve molecular recognition • Nonmolecular modeling, which is advancing tremendously our understanding needs to be paralleled by a quantitative molecular description of pathways
Computational molecular biology methods • The first strategy, the so-called protein bioinformatics, is aimed at the development of computational tools that enable to decipher the information encoded in the protein sequences, thus enabling the prediction of structure and function • The second strategy is based on the laws of physics. One of the most important methods here is molecular dynamics (MD) , which predicts structural, dynamical, and energetic (bio)molecular properties based on Newton laws of motion.
Homology based inference of protein functions ancestral protein a duplication paralogues a b speciation orthologues a a species 1 species 2 • orthologues - often have very similar functions • paralogues - may have related functions C. Orengo, EBI
Function Prediction Molecular function Cellular component Biological process Family characterization HMM, profiles SMART, ProtoNet, Everest, Gene3D, CATH, InterPro Pfam, TIGR, PRINTS, SCOP Protein Structure prediction Comparative Modeling Fold recognition New fold Residues Features predict transmembrane, localisation etc analyse residue features predict disorder, signal peptides, localisation Barcello, DisoPred, FFpred Orthologs identification HAMAP, EggNogg, COGS, KOGS predict protein interactions: ligand-protein protein-protein search for conserved residues TreeDet, ScoreCons, GEMMA, ProteinKeys ETtrace, SCI-PHY, FunShift State of art Free-ware bioinformatics programs !!!
Activity presentation - Introduction to bioinformatics: from sequence to structural models. - Practical session: Blast, Psi-blast, PSI-search, ClustalW/Muscle (jalview), PROMALS, TreeDet, Hhpred, Swiss-Model, GeneSilico. Programs for protein visualization. - Protein structure analysis. Participant cases of interest !!
Sequence alignment Problem: optimize the corrispondence between aminoacids from two (or more) different sequences. Protein Evolution 2 Sequences AGTTTGAATGTTTTGTGTGAAAGGAGTATACCATGAGATGAGATGACCACCAATCATTTC ||||||||||||||||||| |||||||| ||| | |||||| ||||||||||||||||| AGTTTGAATGTTTTGTGTGTGAGGAGTATTCCAAGGGATGAGTTGACCACCAATCATTTC Multiple KFKHHLKEHLRIHSGEKPFECPNCKKRFSHSGSYSSHMSSKKCISLILVNGRNRALLKTl KYKHHLKEHLRIHSGEKPYECPNCKKRFSHSGSYSSHISSKKCIGLISVNGRMRNNIKT- KFKHHLKEHVRIHSGEKPFGCDNCGKRFSHSGSFSSHMTSKKCISMGLKLNNNRALLKRl KFKHHLKEHIRIHSGEKPFECQQCHKRFSHSGSYSSHMSSKKCV---------------- KYKHHLKEHLRIHSGEKPYECPNCKKRFSHSGSYSSHISSKKCISLIPVNGRPRTGLKTsn
We need • A method for scoring similarities between aminoacids. Substitution matrices: Blosum, PAM, Gonnet.... • A penalty value for the insertions and deletions (gaps) • An algorithm for the alignment. Dynamic programing: Needelman e Wunsch (global alignment) or Smith e Waterman (local alignment)
(i,j-1) (i-1,j-1) + punteggio (i,j) + penalizzazione (i-1,j) (i,j) + penalizzazione
Multiple sequence alignment The most important residues at the structural and/or functional level are conserved along evolution, and this can be appreciated from a the alignment of enough members of the family. The aminoacids involved in protein function Structural domains of the protein Provides information on: Residues buried in the core of the protein Remote homologs search
Multiple sequence alignment profile A profile shows all the information contained in a multiple sequence alignment The profile is generated by the calculation of the frequencies of each of the aminoacids in all the positions of the alignment. Used in in PSI-BLAST and PSI-search !!! The latter uses as algorithm the 'exact' Smith and Waterman alignment protocol
Phylogenetic Trees Phylogenetic tree figure showing the evolution of the immune system. (Image by Dr. Nadia Danilova.)
Phylogenetic Trees • It's a way of visualizing evolutionary relationships • Each external node corrisponds to an species • Internal nodes: speciation event • The distance between two nodes is proprtional to the divergence time. • In protein sequences: node -> protein • The distance between two nodes is proprtional to the sequence simillarity.
% aa different Seq1 Seq2 Seq3 Seq4 Seq1 0 5 11 14 Seq2 0 9 10 2.5 Seq3 0 7 1 2 Seq4 0 Phylogenetic Trees
% aa different Cluster 1,2 Seq3 Seq4 Cluster 1, 2 0 ½[d(1,3)+d(2,3)]=10 ½[d(1,4)+d(2,4)]=12 Seq3 0 7 Seq4 0 3.5 2.5 1 2 3 4
% aa diversi Cluster 3,4 Cluster 1, 2 =½d[(Cluster 1,2), 3]+d[(Cluster1,2),4)]=11 5.5 3.5 2.5 1 2 3 4
Fasta (indexing method for a quick alignment poduction: euristic) KITRQDP PDQKRIT DPQTKRI DPQTKRI Data-base search for homology KRTIDPQ BD Score S’
Extreme value distribution P(>x) = 1 – exp(-Ke-x) Probability of finding an alignment with score greater than x K and are parameters related to the maximun value position and to the width of the distribution
Extreme value distribution E-value: expected value !!! is the number of random hit that we expect to obtain with an score S: E= Kmne(-S) S is generally normalized: S’=(S-lnK)/ln2 S’: bit score and therefore: E=mn2-S’
Blast Data-base search for homology KRTIDPQ BD Score S’
PSI (Position Specific Iterated) BLAST • Idea: • to use BLAST results for generating a profile matrix. • Search in database using the profiles, instead of the sequence. • Iterative process: until convergence is reached ?
PSI (Position Specific Iterated) BLAST • Profile search • Alignment of a position specific matrix with a sequence: • Is the same as aligning sequences. • The score of aligning one character of the position with a character from the matrix, is given by the matrix. • There is no need of a substitution matrix
PSI (Position Specific Iterated) BLAST • Value calculation • Dove Pr(ai|col=j) probability of finding the aminoacid ai in column j by chance • Pr(ai) frequence of finding ai in the alignment.
Hidden Markov models • Representation of the multiple sequenc alignments through the 'transition' probability. • We can use an alignment for calculating for each position, together with the profile matrix (HMM of 0th order), the probability of finding, after a particular position, an insertion, a deletion or a match state. • This permits a more complete characterization of a family, and allows better and more sensible searches for remote homologs, by aligning HMM profiles against databases.
Quantità Inizio - 1 1 – 2 2 – 3 3 - 4 4 - 5 5 - end Match - match 4 + 1 3 + 1 3 + 1 1 + 1 1 + 1 4 +1 Match - del 0 + 1 1 + 1 0 + 1 3 + 1 0 + 1 0 + 1 Ins – Del 0 + 1 0 + 1 0 + 1 0 + 1 0 + 1 0 + 1 Del – match 0 + 1 0 + 1 1 + 1 0 + 1 3 + 1 0 + 1 Frequenze Match - match 0.45 0.36 0.36 0.18 0.18 0.45 Match - del 0.09 0.18 0.09 0.36 0.09 0.09 Ins - Del 0.09 0.09 0.09 0.09 0.09 0.09 Del – match 0.09 0.09 0.18 0.09 0.36 0.09 delete Ins A 0.14 C 0.28 E 0.57 A 0.43 C 0.29 E 0.29 Match A 0.43 C 0.29 E 0.29 A 0.17 C 0.67 E 0.17 Inizio Seq1: A C C – E Seq2: E C E – A Seq3: A C E A A Seq4: C – E - E 0.09 0.09 0.36 0.18 0.45 0.36 0.45 0.18
Identification of functional subfamilies multiple sequence alignment, clustering and amino acid identification from functional subfamily Structural model 1 = highly conserved 0 = unconserved Where Pi is the fraction of residues of amino acid type i, and M is the number of amino acid types Putative functional site
Public Database Holdings: The number of different protein folds is limited: Known Folds [ last update: Oct 2001 ] New Folds
Protein evolution Comparative modelling mutation of one amino acid: • the protein does not fold any more • the protein accommodates the replacement with minor modifications:evolutionary pressure! • the protein folds in a completely different structure [ Chothia & Lesk (1986) ]
Homology modeling Target sequence (unknown structure) Known structures (templates) Sequence alignment Template(s) selection Coordinate Mapping Structure evaluation Final structural model Proteins evolving from a common ancestor maintained similar core 3D structures [ Chothia & Lesk (1986) ]
II. Modeling by Satisfaction of Spatial restraints • Find the most probable structure given its alignment • Satisfy spatial restraints derived from the alignment. • Uses probability density functions. • Minimizes violations on restraints. Comparative protein modeling by satisfaction of spatial restraints. A. Šali and T.L. Blundell. J. Mol. Biol. 234, 779-815
Fold Recognition Profile methods Q M T S A F G T A E For each aa we can calculate its frequency: • Found in secondary structure elements • Found in the surface • found in an hydrophobic environment Each aa will be substituted by an intrinsic characteristic MSTLYEKLGGTTAVDLAVAAVAGAPAHKRDVLNQ We can do the same for each of the most representative folds. Genesilico Meta-server Threading Build model of target protein based on each known fold Rank models according to SCORE or ENERGY
Model Evaluation ? Topics: • correct fold • model coverage (%) • C - deviation (rmsd) • alignment accuracy (%) • side chain placement • Structure Analysis and Verification Server: http://nihserver.mbi.ucla.edu/SAVS/
Day activities: Search the human Thioesterase 8 from UNIPROT data base Analyse the annotated data: cross-links, literature, structures ..... Generate the structural model using Hhpred. What is CASP? Analyse the structure using the different methods. Visualise it using VMD and compare it with its template: 1C8U Calculate electrostatic potential. File model.pqr from pdb2pqr server
Protein Structure Resources PDB http://www.pdb.orgPDB – Protein Data Bank of experimentally solved structures (RCSB) CATH http://www.biochem.ucl.ac.uk/bsm/cath Hierarchical classification of protein domain structures SCOP http://scop.mrc-lmb.cam.ac.uk/scopAlexey Murzin’s Structural Classification of proteins DALI http://www2.ebi.ac.uk/daliLisa Holm and Chris Sander’s protein structure comparison server SS-Prediction and Fold Recognition PHD http://cubic.bioc.columbia.edu/predictprotein Burkhard Rost’s Secondary Structure and Solvent Accessibility Prediction Server PSIPRED http://bioinf.cs.ucl.ac.uk/psipred/ L.J McGuffin, K Bryson & David T. Jones Secndary struture prediction Server 3DPSSM http://www.sbg.bio.ic.ac.uk/~3dpssFold Recognition Server using 1D and 3D Sequence Profiles coupled. THREADER: http://bioinf.cs.ucl.ac.uk/threader/threader.html David T. Jones threading program
Protein Structure Classification CATH - Protein Structure Classification [ http://www.biochem.ucl.ac.uk/bsm/cath_new/ ] • UCL, Janet Thornton & Christine Orengo • Class (C), Architecture(A), Topology(T), Homologous superfamily (H) SCOP - Structural Classification of Proteins • MRC Cambridge (UK), Alexey Murzin, Brenner S. E., Hubbard T., Chothia C. • created by manual inspection • comprehensive description of the structural and evolutionary relationships [ http://scop.mrc-lmb.cam.ac.uk/scop/ ]
Class(C)derived from secondary structure content is assigned automatically • Architecture(A)describes the gross orientation of secondary structures, independent of connectivity. • Topology(T) clusters structures according to their topological connections and numbers of secondary structures • Homologous superfamily (H)
Protein Homology Modeling Resources SWISS MODEL: http://www.expasy.org/swissmod/SWISS-MODEL.html Deep View - SPDBV: homepage: http://www.expasy.ch/spdbv Tutorials http://www.expasy.org/spdbv/text/tutorial.htm WhatIf http://www.cmbi.kun.nl:1100/ Gert Vriend’s protein structure modeling analysis program WhatIf Modeller: http://guitar.rockefeller.edu/modeller Andrej Sali's homology protein structure modelling by satisfaction of spatial restraints ROBETTA: http://robetta.bakerlab.org/ Full-chain Protein Structure Prediction Server Programs and www servers very useful in Comparative modeling: http://salilab.org/tools/