Download
1 / 39
390 likes | 554 Vues
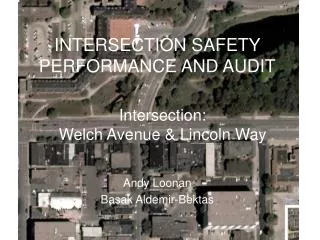
SPR 667 – Assessment of Statewide Intersection Safety Performance. TAC Meeting August 31, 2009 2:00-3:30PM. Agenda. Meeting Objectives. Research Objectives. To quantify the safety performance of typical intersections

E N D
SPR 667 – Assessment of Statewide Intersection Safety Performance TAC Meeting August 31, 2009 2:00-3:30PM
Research Objectives • To quantify the safety performance of typical intersections • To assemble a statewide inventory of intersections including location, geometry, control and volume data. • To characterize by a variety of geometric, operational, and volume features the safety performance of typical intersections. • This performance will include both statistical summaries and exploration of the applicability of predictive models.
Review of Tasks • Project Initiation – complete • Literature Review – complete • Data Assembly & Research Design – 90% complete • Pilot Study – 85% complete • Full Intersection Study – 20% complete • Summary Data Analysis – 20% complete • Develop Safety Performance Functions • Final Report Budget: $122,516 Encumbered: $42,086 (34%) Balance: $80,430
Background • Nearly 21% U.S. fatalities were identified as intersection or intersection-related (2007) • ITE estimates 50% of all reported crashes occurred at intersections • 55% of injury crashes • 48% of property-damage crashes. • Oregon (2007) intersection crashes accounted for 38% of total • 18% of fatal crashes • 39% of injury crashes
Literature Review • PART 1 • A summary of individual geometric, operation, traffic control, and other features • PART 2 • Statistical summaries • Methods for pattern diagnostics • Modeling the safety performance at intersections.
PART 1Sources for Intersection Elements • Harwood et al. “Safety Effectiveness of Intersection Left- and Right- Turn Lanes” • Model Minimum Inventory of Roadway Elements (MMIRE) • Highway Safety Manual (HSM) Draft 3.1 • Elvik and Vaa “Handbook of Road Safety Measures” • Other research • List is not exhaustive
Functional class District or region
PART 2 Pattern Diagnostics and Proportions • Excess proportions • HSM/Safety Analyst • Direct diagnostics • Comparisons of individual crash type proportions to all others
PART 2 Safety Prediction Methods • Regression models • Negative Binomial models • Tree-based regression • Probit models • Urban – rural • Intersection type • Severity or crash type • Volumes significant in all models
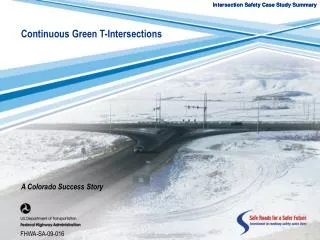
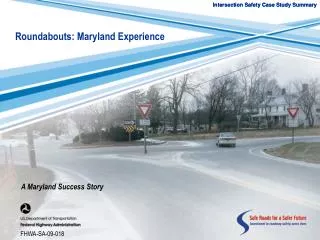
Literature Review Conclusions • Identified a long list of potential intersection elements • Crash rates varied considerably from state-to-state • Most summaries aggregated at relatively high level • Interestingly, all summaries used total crashes and did not develop separate injury rates or rates by any other crash category or causation. • Roundabouts were not included as separate category • Pedestrian or bicycle elements were also absent. • All of the summaries are “snapshots” in time and do not appear to routinely updated.
Literature Review Conclusions • Summarizing the crash data in terms of typical diagnostics appears to be very valuable effort. • Data requirements for predictive models are significant and a primary reason why there has been limited development. • The relationship of intersection characteristics with crash frequency, crash severity, and particular crash types is complex. • In nearly every model, volumes were a significant variable.
Data Assembly • ODOT CAR Code Setup Book • State highway system intersections (9,139) • Other system (143,186) • ODOT Crash Data System (via OrTSDA) • ODOT Digital Video Log (DVL) • ODOT Integrated Transportation Information System (ITIS) • Google Earth / GIS Files • Counts • Traffic counting firms • City/County Engineering & Planning Offices • PORTAL, Google Traffic
Intersection Crash Data • State Highway • Highway and milepost • City • Intersecting street numbers • County • Either mileposted or intersecting street numbers Intersection Possible Intersection-related
CAR Setup Book Remaining records “NULL” traffic control
Pilot Study • Objectives • Test data collection strategies • Define feasible data elements • Estimate effort • Help formulate likely data distributions • Test crash data scripts and summaries • All data elements • 49 NCHRP Flashing Yellow Arrow Intersections • 55 HSM Calibration Project Intersections • Partial data elements • 244 State highway–state highway intersections
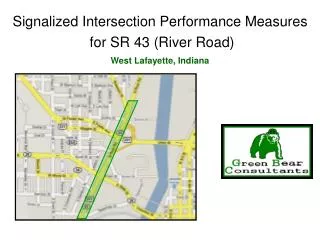
Data Collection: Google Earth Google Earth can provide an aerial view of: -Intersection Type-Turning Lanes -Parking -Channelization -Lat/Long Coord. -Urban/Rural -Bicycle Facilities -Ped. Facilities -Measurements -Length, Width
Data Collection • Resolution is an issue in rural areas when making measurements. John Day: US 26 (005) and US 395 (048)
Digital Video Log • ODOT’s Digital Video Log provides street level views which can be used to identify: • Signalization -Intersections (ex: S = 3 = S) • # of Turning Legs -Medians and Channelization
Crash Frequency (N=347) DRAFT-DRAFT – DRAFT – DRAFT- DRAFT - DRAFT
Crash Rates (N=254) DRAFT-DRAFT – DRAFT – DRAFT- DRAFT - DRAFT
Crash Patterns DRAFT-DRAFT – DRAFT – DRAFT- DRAFT - DRAFT
Draft Results from Pilot Study • Many elements probably not needed for summaries / patterns • Crash script developed • Refining / testing in Access database • Quality control checks needed • Traffic volumes • Hardest to get (off state system) • Time challenge (year of data collection) • Still some other avenues to pursue • Signal timing • Need to study appropriate aggregations
Work Plan Deliverables • 1 - Literature review • 2 - Brief memo to TAC summarizing findings, progress, and recommendations for pilot study intersections and scope • 3 - Interim report summarizing findings of the pilot study, progress, and recommendations for full field study. Preview of statistical summaries that will be conducted. • 4 - Interim report summarizing the results summary data analysis • 5 - Final report
Revised Work Plan • Discussion