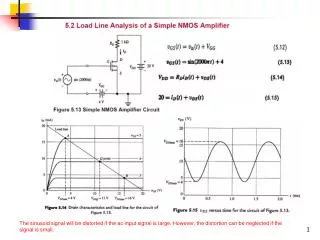
Understanding Graphical Relationships: Drawing and Plotting Straight Line Equations
By the end of this topic, you will be able to draw straight lines based on their equations in the form y = ax + b. You will learn how to create tables of values and plot points accurately on a coordinate grid. The lesson covers lines parallel to the x-axis and y-axis, identifying their equations. In addition, you'll practice drawing various straight line graphs, gaining essential skills in interpreting and constructing graphical relationships in mathematics.

Understanding Graphical Relationships: Drawing and Plotting Straight Line Equations
E N D
Presentation Transcript
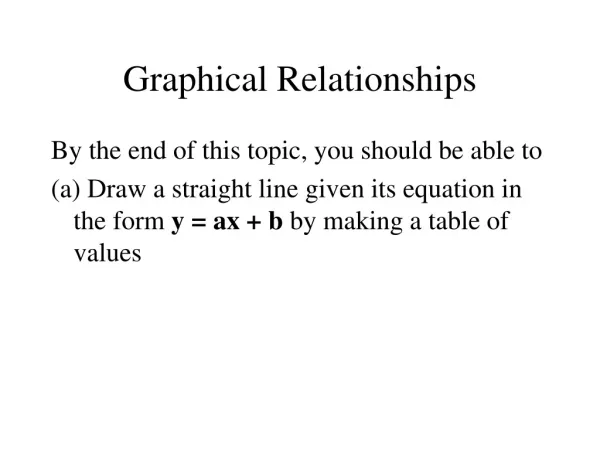
Graphical Relationships By the end of this topic, you should be able to (a) Draw a straight line given its equation in the form y = ax + b by making a table of values
y 10 9 8 7 6 5 4 3 2 1 x 0 -10 1 2 3 4 5 6 7 9 10 -9 -8 -6 -4 -3 -2 8 -7 -5 -1 -1 -2 -3 -4 -5 -6 -7 -8 -9 -10 Plotting Points The points (1,3), (4,3) and (6,3) all lie on the line. A has coordinates (1,5) a y = 3 This is known as the equation of the line. b B has coordinate (3,2)
Lines parallel to the x axis Lines parallel to the y axis y 10 9 8 7 6 5 4 3 2 1 x 0 -10 1 2 3 4 5 6 7 9 10 -9 -8 -6 -4 -3 -2 8 -7 -5 -1 -1 -2 -3 -4 -5 -6 -7 -8 -9 -10 Y = 8 Y = 4 Y = 2 Y = 0 Y = -3 Y = -8 x = 5 x = 9 x = - 4 x = - 7 x = 0
y 10 9 8 7 6 5 4 3 2 1 x 0 -10 1 2 3 4 5 6 7 9 10 -9 -8 -6 -4 -3 -2 8 -7 -5 -1 -1 -2 -3 -4 -5 -6 -7 -8 -9 -10 Drawing Straight Line Graphs y = x y = 3x x y x y 0 0 0 0 3 3 6 2 -4 -4 -9 -3 y = 2x y = ½x x y x y 0 0 0 0 4 8 6 3 2 4 -8 -4 Use grid 1 to draw 4 graphs with me.
y 10 9 8 7 6 5 4 3 2 1 x 0 -10 1 2 3 4 5 6 7 9 10 -9 -8 -6 -4 -3 -2 8 -7 -5 -1 -1 -2 -3 -4 -5 -6 -7 -8 -9 -10 y = x + 1 y = x + 5 x y x y 1 0 5 0 4 3 8 3 -3 -4 0 -5 y = x - 7 y = x + 2 x y x y -7 0 2 0 3 10 7 5 -3 4 -3 -5
y 10 9 8 7 6 5 4 3 2 1 x 0 -10 1 2 3 4 5 6 7 9 10 -9 -8 -6 -4 -3 -2 8 -7 -5 -1 -1 -2 -3 -4 -5 -6 -7 -8 -9 -10 y = 2x + 1 y = 3x – 4 x y x y 1 0 -4 0 7 3 8 4 -7 -4 -10 -2 y = ½x + 5 y = 2x - 5 x y x y 5 0 -5 0 9 8 7 6 1 -8 -9 -2
y 10 9 8 7 6 5 4 3 2 1 x 0 -10 1 2 3 4 5 6 7 9 10 -9 -8 -6 -4 -3 -2 8 -7 -5 -1 -1 -2 -3 -4 -5 -6 -7 -8 -9 -10 y = -x y = -3x + 4 x y x y 0 0 4 0 -5 5 -8 4 6 -6 10 -2 y = -½x - 3 y = -2x x y x y -3 0 0 0 -7 8 -6 3 1 -8 10 -5
y Draw the following straight line graphs 10 9 • y = 2x + 3 • y = 3x – 5 • y = -x + 6 • y = -4 • x = 7 • Y = ½x –2 • Y = - 4x -9 8 7 6 5 4 3 2 1 x 0 -10 1 2 3 4 5 6 7 9 10 -9 -8 -6 -4 -3 -2 8 -7 -5 -1 -1 -2 -3 -4 -5 -6 -7 -8 -9 -10