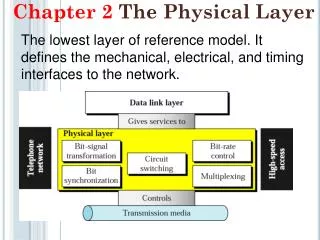
Chapter 3 Physical Layer and Media
Chapter 3 Physical Layer and Media. Data Vs Signal. Signal – a physical phenomenon that can be generated, transmitted, amplified, and processed Data - an intelligence that can be represented by a signal. What about analog and digital data ? Analog data Voice Images Digital data Text


Chapter 3 Physical Layer and Media
E N D
Presentation Transcript
Chapter 3 Physical Layer and Media Lect 3 & 4
Data Vs Signal • Signal – a physical phenomenon that can be generated, transmitted, amplified, and processed • Data - an intelligence that can be represented by a signal Lect 3 & 4
What about analog and digital data ? Analog data Voice Images Digital data Text Digitized voice or images Data Lect 3 & 4
Electromagnetic Signals - Time • Electromagnetic signal can be expressed as a function of time or frequency • Function of time • Analog (varies smoothly over time) • Digital (constant level over time, followed by a change to another level) ie. sound ie. bits Lect 3 & 4
Periodic Signal Characteristics If the signal’s pattern repeats over and over, we called these signals Periodic Signals Periodic Signals can be either Analog or Digital Lect 3 & 4
Analog Periodic Signal Case • Amplitude (A): signal value, measured in volts • Frequency (f): repetition rate, cycles per second or Hertz • Period (T): amount of time it takes for one repetition, T=1/f • Phase (f): relative position in time, measured in degrees • General sine wave is written as • S(t) = A sin(2pft + f) Lect 3 & 4
Varying S(t) = A sin(2pft + f) Lect 3 & 4 Note: 45 degrees because p is 180 degrees
What is Wavelength ? • The distance an electromagnetic wave can travel in the amount of time it takes to oscillate through a complete cycle • Wavelength (w) = signal velocity x period or propagation speed x period • Recall: period = 1 / frequency Another perspective of Wavelength: how far did this signal travel AS the signal goes through a FULL cycle ? Lect 3 & 4
Electromagnetic Signals Electromagnetic signal can be expressed as a function of time or frequencyFunction of frequency (more important) Lect 3 & 4
Electromagnetic Signals - Frequency • Electromagnetic signal can be expressed as a function of time or frequency • Function of frequency (more important) • Spectrum (range of frequencies) • Bandwidth (width of the spectrum) When we talk about spectrum, we mean the range of frequencies the electromagnetic signal takes on In the example, the signal has a Frequency range of f to 3f Therefore, a electromagnetic signal can be a collection (addition) of periodic analog Signals (Composite Signal) Lect 3 & 4
Composite Periodic Signal According to FOURIER ANALYSIS, a composite signal is a combination of sine waves with different amplitudes, frequencies and phases. Could converged to a square wave 3rd harmonic 9th harmonic Lect 3 & 4
Digital Signaling • represented by square waves or pulses • Refers to transmission of electromagnetic pulses that represents 1’s and 0’s 1 cycle amplitude (volts) time (sec) frequency (hertz) = cycles per second Lect 3 & 4
Digital Signal Rate • Each bit’s signal has a certain duration • Example, given a data rate of 50 kbps (or 50,000 bps) • Each would have a 0.02 microseconds duration • Duration (or bit length) = 1/50000 = .00002 sec = .02 msec Lect 3 & 4
Digital Signal Sending 1 bit per level Sending 2 bits per level How many levels needed to send 5 bits at a time ???? # bits per level = log2 x (#oflevels) Lect 3 & 4
Baseband Transmission • In sending the digital signal over channel without changing the digital signal to an analog signal • Use low-pass channel – meaning the bandwidth can be as low as zero • Typical: 2 computers directly connected Lect 3 & 4
Digital Text Signals • In transmitting text, the text is first converted to binary data (1’s and 0’s) • Then the binary info in converted to voltage pulses • Voltage pulses are then transmitted across the transport medium • How do we represent letters, numbers, characters in binary form? • Most common current forms: ASCII, EBCDIC, ISO-7 Lect 3 & 4
ASCII Lect 3 & 4
EBCDIC Lect 3 & 4
Channel Capacity • As we know, impairments limits the actual data rate realized • The actual rate realized at which data can be transmitted over a given path, under given conditions is called Channel Capacity • Four concepts • Data rate – the rate, in bps, the data can be transferred • Bandwidth – constrained by the Tx and transport medium – expressed in cycles per second or Hertz • Noise – average level of noise over the communication path • Error rate – the rate in which erroneous bits are received Lect 3 & 4
Impairments Lect 3 & 4
Attenuation Loss of energy – the signal can lose energy as it travels and try to overcome the resistance of the medium Decibel (dB) is a unit of measure that measures a signal’s lost or gain of strength – can be expressed in power or voltage dB = 10 log10 [P2/P1] = 20 log10 [V2/V1] Samples of the power or voltage taken at times 1 and 2. Lect 3 & 4
Distortion Distortion is when the signal changes its form. The each signal that makes up a composite signal could have different propagation speeds across the SAME medium – because of this, the different signals could have different delays (arriving at the receiver) – this causes a distortion. Lect 3 & 4
Noise Thermal Noise - the uncontrollable or random motion of electrons in the transport medium which creates an extra signal (not sent by the transmitter) Induced Noise – undesired devices acting as a transmitting antenna and those signals being picked up Cross Talk Noise – effect of one wire crossing another wire Impulse Noise – spikes in energy (ie lightning) Lect 3 & 4
Signal to Noise Ratio SNR = avg-signal-power/avg-noise-power High SNR – good (less corruption) Low SNR – bad (more noise than good power) SNR is described in Decibels (dB) SNRdB = 10 log10 SNR Lect 3 & 4
Shannon Equation • Shannon’s equation is used to determine the actual capacity of a channel given noise exist • C = B log2 (1 + SNR) • B Bandwidth • C Channel Capacity • SNR Signal-to-noise ratio Lect 3 & 4
Nyquist Equation • Given noise, determine the maximum bit rate • BitRate = 2 x B x log2 L • B is the bandwidth of the channel • L is the # signal levels used • BitRate unit is bps (bits per second) Having 2 levels is reliable because a Rx can interpret 2 levels – suppose you had 64 levels – less reliable or more complex to interpret Lect 3 & 4
Bandwidth Bandwidth is a measure of performance Bandwidth in hertz – range of frequencies Bandwidth in bps – bps a channel can handle Lect 3 & 4
Throughput Throughput is a measure of performance – how fast data can flow through a network • Bandwidth could be what the channel could handle however, Throughput would be the amount that actually flowed through • Bandwidth – potential • Throughput – actual Lect 3 & 4
Latency Latency is a performance measure – how long it takes an message to completely arrive to the receiver Latency consist of • propagation time (time for a bit to travel from Tx to the Rx) propagation time = distance/propagation-speed • transmission time (time for a message to be sent) Transmission time = message-size/bandwidth • queuing time (time each intermediate node holds the message) • processing time (time each node spends processing the message) Note: if message is small, more bandwidth exists and therefore, the latency is more of propagation time versus transmission time Lect 3 & 4
Chapter 4: Digital Transmission Physical Layer Issues Lect 3 & 4
DIGITAL-TO-DIGITAL CONVERSION Can represent digital data by using digital signals. The conversion involves three techniques: line coding – converting bit sequences to signals block coding – adding redundancy for error detection scrambling– deals with the long zero-level pulse issue Line coding is always needed; Block coding and scrambling may or may not be needed. Lect 3 & 4
Line coding and decoding At Tx - Digital data represented as codes is converted to a digital signal via an encoder At Rx – Digital signal is converted back to digital codes via a decoder Lect 3 & 4
Signal element versus data element Data element - smallest entity representing data Signal element – shortest unit of a digital signal r – is the ratio of # of data elements carried per signal element Example of adding extra signal elements for synchronization Lect 3 & 4
Data Rate Versus Signal Rate Data rate (or bit rate) - # of data elements (or bits) transmitted in 1 second – bits-per-second is the unit Signal rate (pulse rate or baud rate) - # of signal elements transmitted in 1 second – baud is the unit OBJECTIVE ALWAYS: increase data rate while decreasing signal rate – more “bang” for the “buck” Is it intuitive that if you had a data pattern of all 0s or 1s, it would effect the signal rate ? Therefore to relate data-rate with signal-rate, the pattern matters. Worst Case Scenario – we need the maximum signaling rate (alternating 1/0s) Best Case Scenario – we need the minimum signaling rate (all 1/0s) Focus on average case S = c x N x 1/r N – data rate (bps) c – case factor S - # of signal elements r – ratio of data to signal Lect 3 & 4
Example A signal is carrying data in which one data element is encoded as one signal element ( r = 1). If the bit rate is 100 kbps, what is the average value of the baud rate if c is between 0 and 1? Solution We assume that the average value of c is 1/2. The baud rate is then Lect 3 & 4
Bandwidth Now we understand what baud rate is And we understand what bit rate (or data rate) is Baud rate - # of carriers on the transport Data rate - # of passengers (or bits) in the carriers With this, we clearly see that baud rate effects bandwidth usage Signaling changes relate to frequency changes – therefore the bandwidth is proportionate with the baud rate: Bmin = c x N x 1/r or Nmax = 1/c x B x r minimum bandwidth maximum data rate (given the bandwidth) Lect 3 & 4
Example The maximum data rate of a channel (see Chapter 3) is Nmax = 2 × B × log2 L (defined by the Nyquist formula). Does this agree with the previous formula for Nmax? Solution A signal with L levels actually can carry log2L bits per level. If each level corresponds to one signal element and we assume the average case (c = 1/2), then we have Lect 3 & 4
Decoding Issue 1 Keep in mind the Rx decodes the digital signal – how is it done ? • Rx determines a “moving average” of the signal’s power or voltage levels • This average is called the baseline • Then the Rx compares incoming signal power to this average (or baseline) • If higher than the baseline, could be a 1 • If lower than the baseline, could be a 0 • In using such a technique, is it intuitive that long runs of 0s or 1s could skew the average (baseline) ? – this is called baseline wandering (effects Rx’s ability to decode correctly) Lect 3 & 4
Decoding Issue 2 Effect of lack of synchronization For the Rx, to correctly read the signal, both the Tx and Rx “bit intervals” must be EXACT Example of Rx timing off – therefore decoding the wrong data from the signal To fix this, the Tx could insert timing info into the data that synchs the Rx to the start, middle and end of a pulse – these points could reset an out-of-synch Rx Lect 3 & 4
Example In a digital transmission, the receiver clock is 0.1 percent faster than the sender clock. How many extra bits per second does the receiver receive if the data rate is 1 kbps? How many if the data rate is 1 Mbps? Solution At 1 kbps, the receiver receives 1001 bps instead of 1000 bps. At 1 Mbps, the receiver receives 1,001,000 bps instead of 1,000,000 bps. NOTE: Keep in mind that a FASTER clock means SHORTER intervals Lect 3 & 4
Line coding scheme categories Lect 3 & 4
Unipolar NRZ scheme Data Signal Voltages on one side of the axis Positive voltage signifies 1 Almost zero voltage signifies 0 Power needed to send 1 bit unit of resistance Lect 3 & 4
Polar NRZ-L and NRZ-I schemes change no change Voltages on both sides of the axis NRZ-L (level) version – voltage level determines the bit value NRZ-I (invert) version – voltage change or no-change determines the bit value (no change = 0, change = 1) Lect 3 & 4
Polar RZ scheme Uses 3 values: positive, negative and zero Signal changes Not between bits BUT during the bit H-to-L in middle for 1 L-to-H in middle for 0 Positioning occurs at the beginning of the period Lect 3 & 4
Polar biphase: Manchester and Differential Manchester Schemes Manchester: H-to-L=0, L-to-H=1 Differential Manchester: H-to-L or L-to-H at begin=0, No change at begin=1 Lect 3 & 4
Bipolar schemes: AMI and pseudoternary Bipolar encoding uses 3 voltage levels: positive, negative and zero. One data element is at ZERO, while the others alternates between negative and positive Alternate Mark Inversion (AMI) scheme – neutral zero voltage is 0 and alternating positive and negative voltage represents 1 Pseudoternary scheme – vice versa from the AMI scheme Lect 3 & 4
Multilevel Schemes These schemes attempt to increase the number of bits per baud Given m data elements, could produce 2m data patterns Given L levels, could produce Ln combinations of signal patterns If 2m = Ln, each data pattern is encoded into one signal pattern (1-to-1) If 2m < Ln, data patterns use a subset of signal patterns – could use the extra signal patterns for fixing baseline wandering and error detection Classify these codes as mBnL where: m – length of the binary pattern B – means Binary data n – length of the signal pattern L - # signaling levels (letters in place of L: B=2, T=3 and Q=4) Lect 3 & 4
Multilevel: 2B1Q scheme 2B1Q Data patterns of size 2 bits Encodes 2-bit patterns in one signal element 4 levels of signals If previous level was positive and the next level becomes +3, represents 01 If previous level was positive and the next level becomes -3, represents 11 Lect 3 & 4
Multilevel: 8B6T scheme Data patterns of size 8 bits Encodes 8-bit patterns in six signal elements Using 3 levels of signal Lect 3 & 4