Download

1 / 49
490 likes | 651 Vues
Managing Local Energy and Environment Interfaces: AIM-Local Model Applications. P.R. Shukla. Introduction. Modeling the dilemma of providing energy services and protecting the environment in a local region. SO 2 , NO X , SPM, CO 2. Acid precipitation. Air pollutants. Energy Technology.

E N D
Managing Local Energy and Environment Interfaces:AIM-Local Model Applications P.R. Shukla
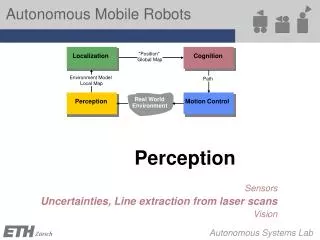
Introduction • Modeling the dilemma of providing energy services and protecting the environment in a local region SO2, NOX, SPM, CO2 Acid precipitation Air pollutants Energy Technology Energy Service Demand
Definitions Parameters Variables Constraints Service demand Environmental target Available energy supply Linear programming Solver Operating capacity Maximum shares of technologies Maximum exchange of stock Objective Function Total cost minimum AIM Local Model: Methodology
Model Formulation (1) Service demand constraint Al,j,i : Service supply quantity by technologies and regions Ψl,j,i : Social service efficiency by technologies and regions Xl,p,i : Operating quantity by technology combinations (l,p) and regions
(2) Operating capacity constraint Λl,i : Operating efficiency by technologies and regions Sl,p,i : Stock quantity by technology combinations and regions
(3) Energy supply constraint : Energy consumption by fuels, technologies and regions ξk,l,i :Energy efficiency improvement by operation style and maintenance
(4) Emission constraint Emissions: Emission factors: dl,p,im : Pollutant release ratio by technology combinations and regions
(5) Cost functions Initial cost: Operating cost: Environmental cost:
Model Formulation in GAMS An Example of Transport Problem SETS PARAMETERS VARIABLES EQUATIONS
Input File for GAMS AIM-Local Database System AIM-Local model GAMS version Output file from GAMS GAMS Input file from IDRISI IDRISI32 AIM-Local Database System AIM workshop 2001
Large Point Source and Area Source 3.Sector Emission by point Large Point Source Emission by City Emission by City and Sector Emission by Region and Sector Area Source 2.Region
Structure of AIM-Local Database Energy service tech. (LT) & Air Pollution Control (P) - Energy Cons.(K L P T), - Service Supply (L J T) - Fixed Cost (L P T) - Removal Rate (L P T) etc. Energy Service Tech.(L T) 5. Service 6.Technology Air Pollution Control(P) Service Demand( I J ) 7.Stock Stock Quantity ( L T0) Subsidy ( I L T ) 10.Counter- measure Regulation( ME M T) Technology Selection Module (AIM-Local GAMS ver.) Share Potential( I L J T ) 8.Share Maintenance etc.( I LT ) Operating Rate ( I L T ) 9.Performance Tax( ME M T) I : LPS or Area L : Energy Device P : Removal Porcess J : Service K : Energy M : Gas (CO2, SO2, NO2) T : Time ME : Group on measure Energy Consumption CO2 Emission SO2/NO2 Emission ( I L T ) Energy Price Emission Factor ( K T ) 4.Energy
Input and Output Input: (1) Energy • Fuel type, Fuel price, • Emission factors by fuels and technologies • Energy resource constraints (2) Technology • Initial cost, Operating cost • Life-span, Capacity, Share • Energy consumption by fuels for a unit production • Pollutants removal technologies and combinations
(3) Service demand by regions and sectors • Historical service data • Future service demand forecast • Economic development plans from the local government • Development plans from the local industries (4) Air pollutant emission constraints • Current air pollutant emissions • Local environmental protection policies
Output: (1) Aggregated results • Total energy consumption by years • Total costs by years • Total CO2 emissions by years • Total air pollutant emissions by years (2) Technology options • CO2 emissions by technologies and years • Air pollutant emissions by technologies and years • Energy consumption by technologies and years
(3) Service output • Service output by regions, sectors, technologies and years (4) Energy balance table • Energy balance table for the local region by years (with energy information for sectors, technologies and fuel types)
Model Features • Simplified Structure • Modeling local environmental constraints • Direct benefit and co-benefit of counter measures • Flexible model structure to cope with various practical situation in different regions • GAMS programming • GIS Interface
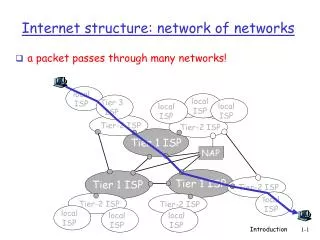
Why GIS? • Capture location sensitivity • Provide layered information • Analyze time slices • Integrate location and time information in a consistent framework
Spatial Data Characteristics • Spatial data are characterized by information about position, connections with other features and details of non-spatial characteristics • latitude and longitude as a geographical reference • connection details such as which service roads, lifts and ski trails would allow the meteorologist access to the weather station • non-spatial (or attribute) data, for instance details of the amount of snowfall, temperature, wind speed and direction
Data Models Raster data Model (sometimes referred to as grid) Vector Data Model (an entity is a component or building block used to help data organization)
GIS Database Integrated GIS Database
Beijing City • Economic Features • Per capita GDP: 3 times of the national level • Industry > 60% of GDP • Heavy Industry > 80% of industrial GDP
Sources: • Beijing Municipal Statistics Bureau (1999). • Beijing Municipal Government (1992). • Beijing Municipal Planning Commission (2000b).
2000 – 2005: 9.5% 2006 – 2010: 9.0% 2011 – 2020: 8.5% • Sources: • Beijing Municipal Statistics Bureau (2000). • Beijing Municipal Planning Commission (2000). • Beijing Municipal Government (1992).
Beijing Cement Plant Technology: dry kiln with pre-decomposition process Capacity : 2000 t/d Production: 525# Portland cement, 0.74 Mt /a Location: Changping District, Beijing City
Refinery Beijing Yanshan Petroleum and Chemical Group Corporations Technology: heavy oil based refinery process Capacity : 6.0 Mt /a Location: Fangshan District, Beijing City
Ethylene Beijing Yanshan Petroleum and Chemical Group Corporations Technology: Diesel oil based process Capacity : 0.45 Mt /a Location: Fangshan District, Beijing City
Technology: coal boiler Capacity : 4000 MW Location: Shijingshan District, Beijing City Beijing Shijingshan Thermal Power Plant
Beijing Capital Steel Corporations Capacity : 8.00 Mt Location: Shijingshan District, Beijing City
Area source data • Residential sector • Commercial sector • Transportation sector • Other sectors
Results Beijing Capital Steel Corporations Beijing Shijingshan General Power Plant
1995 SO2 intensity (t-SO2/km2) 2020 (case 1) 2020 (case 8) 2020 (case 6)
1995 CO2 intensity (t-C/km2) 2020 (case 1) 2020 (case 6)
Ahmedabad City, India • High economic and demographic growth • Industrial base • Growing transport demand
Ahmedabad Gujarat India
Ahmedabad Urban Area Ahmedabad District Ahmedabad District Note: Figures in brackets show % Urban share
Ahmedabad Municipal Area North Zone West Zone East Zone River Sabarmati South Zone Central Zone
Pirana Landfill Chandola Lake/Landfill Pirana MSP Vatva GIDC Narol GIDC *GIDCs have many Textile processing and Chemical units AEC Gas Power plant Ahmedabad Municipal Area (South Zone)