Download
1 / 10
100 likes | 140 Vues
Revenue impact of major incentives on corporate taxpayers (In INR Crore)

E N D
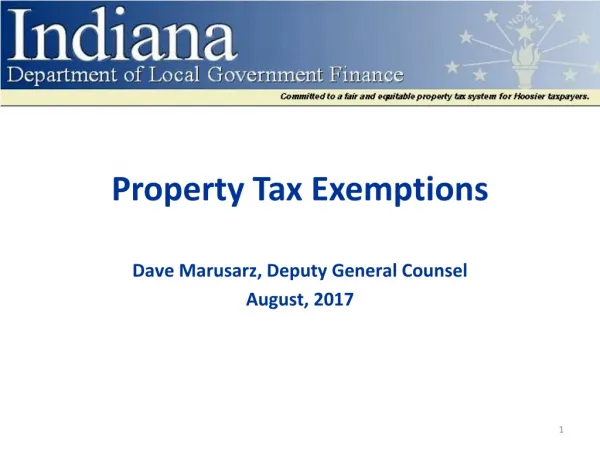
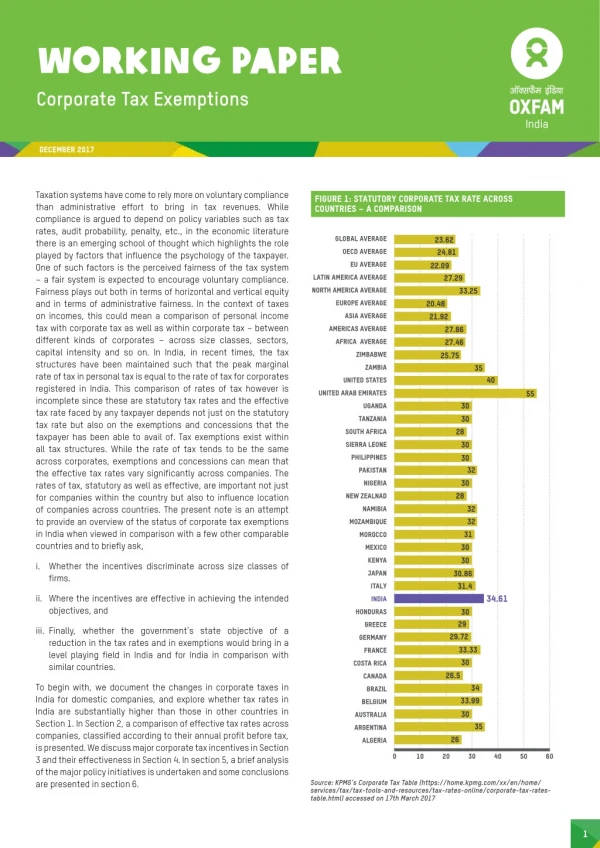
WORKING PAPER Corporate Tax Exemptions DECEMber 2017 Taxation systems have come to rely more on voluntary compliance than administrative effort to bring in tax revenues. While compliance is argued to depend on policy variables such as tax rates, audit probability, penalty, etc., in the economic literature there is an emerging school of thought which highlights the role played by factors that influence the psychology of the taxpayer. One of such factors is the perceived fairness of the tax system – a fair system is expected to encourage voluntary compliance. Fairness plays out both in terms of horizontal and vertical equity and in terms of administrative fairness. In the context of taxes on incomes, this could mean a comparison of personal income tax with corporate tax as well as within corporate tax – between different kinds of corporates – across size classes, sectors, capital intensity and so on. In India, in recent times, the tax structures have been maintained such that the peak marginal rate of tax in personal tax is equal to the rate of tax for corporates registered in India. This comparison of rates of tax however is incomplete since these are statutory tax rates and the effective tax rate faced by any taxpayer depends not just on the statutory tax rate but also on the exemptions and concessions that the taxpayer has been able to avail of. Tax exemptions exist within all tax structures. While the rate of tax tends to be the same across corporates, exemptions and concessions can mean that the effective tax rates vary significantly across companies. The rates of tax, statutory as well as effective, are important not just for companies within the country but also to influence location of companies across countries. The present note is an attempt to provide an overview of the status of corporate tax exemptions in India when viewed in comparison with a few other comparable countries and to briefly ask, Figure 1: Statutory Corporate Tax Rate across Countries – A Comparison global average 23.62 24.81 oecd average eu average 22.09 latin america average 27.29 north america average 33.25 europe average 20.48 21.92 asia average americas average 27.86 27.46 africa average zimbabwe 25.75 zambia 35 40 united states united arab emirates 55 30 30 uganda tanzania 28 south africa 30 30 sierra leone philippines 32 pakistan 30 nigeria 28 new zealnad 32 32 31 namibia mozambique morocco 30 30 mexico kenya i. Whether the incentives discriminate across size classes of firms. 30.86 japan 31.4 italy ii. Where the incentives are effective in achieving the intended objectives, and 34.61 india 30 honduras 29 greece iii. Finally, whether the government’s state objective of a reduction in the tax rates and in exemptions would bring in a level playing field in India and for India in comparison with similar countries. 29.72 33.33 germany france 30 costa ricA 26.5 canada To begin with, we document the changes in corporate taxes in India for domestic companies, and explore whether tax rates in India are substantially higher than those in other countries in Section 1. In Section 2, a comparison of effective tax rates across companies, classified according to their annual profit before tax, is presented. We discuss major corporate tax incentives in Section 3 and their effectiveness in Section 4. In section 5, a brief analysis of the major policy initiatives is undertaken and some conclusions are presented in section 6. 34 brazil 33.99 belgium 30 australia 35 argentina 26 algeria 0 10 20 30 40 50 60 Source: KPMG’s Corporate Tax Table (https://home.kpmg.com/xx/en/home/ services/tax/tax-tools-and-resources/tax-rates-online/corporate-tax-rates- table.html) accessed on 17th March 2017 1
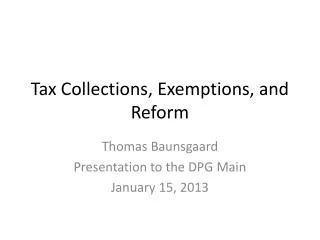
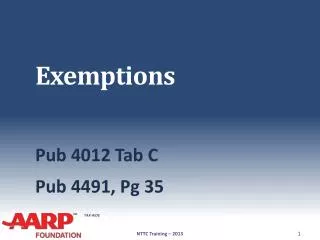
Figure 2: NBER’s Comparison of Average Book Effective Tax Rates, 2006 to 2011 Section 1: Corporate Tax Rates in India – A Comparison MIDDLE EAST TAX HAVENS In corporate taxes, in India, there was a period when the structure incorporated a large number of taxes. Till 1983-84, apart from the distinction between closely held and widely held companies as well as between domestic companies and foreign companies, there was also a size class wise variation in the tax rates. The size class variation was eliminated in 1983-84 while the distinction between closely held and widely held companies was removed in 1994-95, after which the rates of tax too have been reduced with the tax rate being 30 percent plus cesses till 2015-16. In other words, in terms of the statutory tax rate, there are no differences between tax payers based on the level of income. This could be considered an indicator of fairness. Further, in more recent times a mild degree of progressivity has been introduced through the way surcharges have been defined on companies – from 2008-09, the surcharge has varied with the income of the company. In the budget of 2016-17 for instance, the surcharge has been made applicable only to companies where income is higher than one crore. Further the rate of surcharge increases from 7 percent to 12 percent if the income exceeds INR 10 crore (1 crore = 10 million). SINGAPORE TAIWAN non-us average etr = 23% SWITZERLAND UK SWEDEN CHINA INDIA AUSTRALIA CANADA LATIN AMERICA OTHER EUROPE OTHER ASIA KOREA REP. OTHER AFRICA GERMANY SOUTH AFRICA FRANCE US To understand India’s corporate rates in relation to other countries, the figure 1 below provides a comparison for a few countries. The statutory tax rates (STR) of India does not appear to be higher than the average tax rate for other countries. In other words, India does not appear to be an outlier in this comparison. However, as mentioned earlier, there exist a number of exemptions and concessions that are provided in the tax regime, which change the impact of the tax on companies. JAPAN 0% 5% 10% 15% 20% 25% 30% 35% 40% Source: PWC (2016, Figure 5) Figure 3: Comparison of effective tax rates across companies by size Figure 2, reproduced from the National Bureau of Economic Research (NBER’s) Comparison of Average Book Effective Tax Rates for the period 2006 to 2011, provides comparison of effective tax rates (ETR) across countries in comparison with the other countries captured in the chart, India belongs to the group of countries which have relatively medium effective corporate tax rate. 50 40 36.7 31.4 31.6 30 25.0 23.3 23.2 21.7 21.2 21.4 20 Section 2: Comparison across Companies in India 10 0 A comparison of effective tax rates across companies classified according to their annual profit before tax shows that smaller companies face higher ETR as compared to larger companies. Figure 3 shows that companies having annual profit before tax (PBT) up to INR 10 crore face higher effective tax rates. The ETR for these companies has gone up from 31.6% in 2011-12 to 41.2% in 2015-16. An increase in ETR by 5% by every two years is observed for small companies, as compare to 2% (4% in 2015-16) for medium companies. This clearly shows that small companies are unable to take benefits of existing tax exemption schemes and higher tax rate becomes a barrier for new companies to enter into the market. fy2011-12 fy2012-13 fy2013-14 50 41.2 40 36.2 Companies having Annual PBT: 29.0 30 26.6 25.5 up to INR 10 Crore 23.2 20 INR 10 to 50 Crore above INR 50 Crore 10 A comparison of statutory tax rate (STR) and ETR across two broad groups of companies shows that small companies face ETR which is higher than STR. This is due to the fact that for these companies PBT is lower than income considered for the purpose of corporate 0 fy2014-15 fy2015-16 Source: Computed from Union Budget Documents (various years) by the authors. 2
Table 1: Comparison of Statutory and Effective Tax Rates across Companies Statutory Tax Rate (STR) Effective Tax Rate (ETR) Companies having Annual Income above INR 10 crore Companies having Annual PBT up to INR 10 crore Companies having Annual PBT above INR 10 crore Statutory Tax Rate (STR) 32.45 32.45 31.65 21.87 FY2011-12 FY2012-13 FY2013-14 FY2014-15 FY2015-16 32.45 32.45 31.38 21.45 32.45 33.99 36.69 21.74 32.45 33.99 36.22 23.46 33.06 34.06 41.19 26.87 Source: Computed from Revenue Foregone Statement, Union Budget Documents (various years) years. Further, in terms of the individual exemptions, while the amount associated has declined for some incentives like area based exemptions, for most of the others, the incentives in nominal terms have increased over the years. In terms of the magnitude, two of the major incentives are accelerated depreciation benefits and benefits provided to special economic zones. Together, these account for about 60 percent of the gross revenue foregone. Two other incentives which each accounted for over INR 10,000 crore of revenue foregone in the year 2015-16 are incentives given for investments in research and development and incentives given to power sector units. income tax liability. For companies having annual PBT up to INR 10 crore, increase in ETR during 2011-12 to 2014-15 is observed, even if STR remains unchanged, and this is due to divergence between growth rate in income and PBT. Though the statutory tax rate is higher for companies having annual PBT above INR 10 crore, their ETR is lower as they derive larger benefits from existing tax exemptions. ETR for all companies has gone up during 2013-14 to 2015-16, and there are two reasons for that. First, a rise in STR is observed in 2015-16 and second, the tax exemptions did not grow as faster as corporate income. In fact total exemption (net revenue foregone) as percentage of total corporate income tax (CIT) collection is going down. Table 2: Revenue Impact of Major Incentives on Corporate Taxpayers (in INR Crore) Section 3: Revenue Foregone - Trends in India 2015-16 Description of incentive 2014-15 2013-14 6,559 Area based exemptions 9,015 7,189 21,218 Special economic zones 18,630 18,873 The impact of exemptions and concessions on revenue collection is summarized through an estimate of the revenue foregone within the budget document. Before analysing the observed numbers, it is important to recognize that the revenue foregone estimates should not be read as potential revenue that the government could have collected but did not collect since it chose to give exemptions and concessions. To the extent, the incentive regimes worked, there would be taxpayers who exist only because of the existence of the incentive regimes. If these regimes are eliminated, these companies would cease to exist and the corresponding revenue too would not accrue to the government. Only a part of the revenue that can be attributed to normally profitable companies would have accrued to the government, i.e., potential revenue that the government could have collected in the absence of exemptions and concessions would be a fraction of the reported revenue foregone; there are no straight forward ways of estimating the size of this fraction. 10,131 Incentives for R&D 8,450 7,592 Accelerated Depreciation Benefits 50,027 41,531 34,278 5,130 Infrastructure 4,334 3,353 11,621 Power 9,756 9,937 5,986 Mineral Oil 3,227 6,245 1,233 Telecom 1,745 1,431 3,272 Others 2,247 4,034 115,177 Total (Gross) 100,722 91,144 Recovered through Minimum Alternative Tax (MATS) 38,318 35,655 33,351 76,859 Net Revenue Foregone 65,067 57,793 The following table 2 presents a summary of the revenue foregone through the incentives provided within the Indian income tax regime to corporate tax payers. This table shows that while the net revenue foregone has increased in absolute terms over the years, the growth has not been as fast as the growth in revenue collection, implying thereby that the revenue foregone as a proportion of revenue collected has declined across the three As Percentage (%) of Total Corporate Income Tax Liability (21.5%) (21.8%) (22.4%) Total Corporate Income Tax Liability 357,968 298,205 257,858 Source: Computed from Union Budget Documents (various years) 3
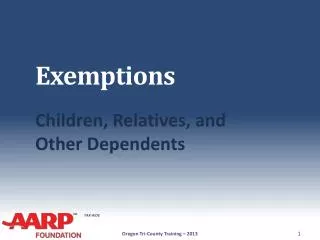
Tax incentives are used by governments to achieve certain policy goals. For instance, the incentives given to special economic zones are expected to achieve a number of policy goals, but viewed carefully, it can be seen as a package to encourage the creation of good infrastructure for the use of exporters. Similarly, accelerated depreciation provisions are expected to increase capital formation in the country and area based exemptions are expected to influence the choice of location of industries to places that fail to attract investment on their own merit. In the following section, some of these important exemptions are studied to understand whether one can draw any inference on the effectiveness of these tools to achieve policy goals of the government in the next section. Figure 4: Revenue Foregone as a percentage of Revenue Generated (Total Income Tax) 70 59.36 58.59 60 50 38.84 40 33.92 28.16 30 24.73 20 9.95 8.81 10 0 GERMANY KOREA NETHERLA- SPAIN UNITED KINGDOM UNITED STATES INDIA CANADA (2004) (2006) (2006) NDS (2006) (2008) (2006) (2008) (2007-08) To understand whether India is an outlier in providing incentives of this kind, we can look at the examples from other countries which too provide tax incentives or a revenue foregone statement is available. Information for some countries is presented below. The figure suggests that India does not emerge as an outlier in the extent of tax incentives provided. In fact, of the 8 countries considered, three have levels higher than that for India – United States, United Kingdom and Canada. It may be noted that the Figure 4 provides information for the period around 2006-08. Source: Computed from OECD (2010) and Union Budget, GoI (2009) expenditures these may not be duly reflected as it is not a formal concession being extended as a policy position. For instance, agricultural income in India is beyond the purview of income tax by the union government. In the computation of revenue foregone, this would not be reflected anywhere. Different countries provide incentives under corporate income tax for different reasons. Among the incentives, many countries provide incentives on account of research and development, accelerated depreciation and special regions/ zones. Therefore, incentives provided in India are not standalone incentives; many countries provide similar incentives under corporate tax. Inter country comparisons on tax expenditure should however be viewed with caution. Tax (incentives) expenditures are computed as deviations from a standard tax rate. However, by law or Constitutional provisions in certain countries, certain sources of income could have a different treatment. In the computation of tax Table 3: Incentives under Corporate Income Tax across Countries Incentive ARGENTINA BANGLADESH CHINA FRANCE GERMANY INDONESIA ITALY PHILIppines RUSSIA S.KOREA USA Export-oriented companies Mining companies Special economic zones R&D / R&D Credits Software industry Biofuel industry Investment in capital as- sets and infrastructure projects Petroleum industry Export processing zone, economic zone and hi-tech park Power generation Industrial or infrastruc- ture undertaking Information technology industry Accelerated Depreciation Special regions / zones Energy/ Environmental Statutory Tax Rate (%) (IBFD Database) 35 25-40 25 33.33 15.83 25 27.5 30 20 10-22 35+12 Source: Computed from IBFD database 4
of intellectual property received from abroad, there seems to be no evidence to suggest that the companies witness an improvement in the process of production upon incurring R&D expenses. Further, the income per unit of the patents, trademark and industrial design have remained far below the global average which suggest that while India is increasingly registering patents abroad it is not registering a comparable income on its intellectual property. Section 4: Effectiveness of incentives It should be noted that in assessing the effectiveness of an incentive regime, it would be inadequate to ask whether there are any companies which benefited from the provisions of this regime. There would always be companies which seek to utilize the provisions to reduce the tax liability and this is to be expected. The need is to go beyond and ask whether the objective for which the regime was designed would be achieved. In this section, an attempt is made to identify the objective and formulate an appropriate hypothesis to be tested to assess whether the objective is being satisfied. For this purpose, four exemption schemes are being examined. Area Based Exemptions: Fiscal incentives have been given to encourage investment in ‘backward’ areas in many ways for many years. These incentives have been a combination of tax incentives and subsidies (capital, interest and / or transport subsidies). The questions to ask could be firstly, did the investment in these states increase subsequent to the introduction of the scheme, and secondly, is this attributable to a shift in economic activity from some other states to these states. A recent analysis carried out by Rao et al. (2016) concludes that: Special Economic Zones (SEZs): Revenue foregone statement shows that corporate tax incentives enjoyed by the Special Economic Zones (SEZs) is the second largest after accelerated depreciation. The SEZ Act 2005 was legislated in India with an objective to generate world class infrastructure that can support production and more importantly exports from India. The intended benefits from this provision can be read as increase in India’s exports, increase in investment especially in infrastructure and increase in employment. If one looks at the number of SEZs set up and the exports from these zones, then the policy would appear to be a success. But, if the zones are growing at the cost of exports from the rest of the economy, then it cannot be considered a success. Rao et al. (2016) explore the effectiveness of the SEZ policy based on its impact on the aggregate economy, the results from which are summarized below. The analysis does not suggest that the policy introduced any statistically significant change in the performance of the Indian economy either in terms of the level of aggregate investment or exports. Further, since all investment will generate some amount of employment, to establish that SEZs generate employment, it is important to ask whether SEZs are more employment intensive than other domestic enterprises. The study shows that given the level of investment, it would appear that employment generation in SEZs is considerably lower than in the manufacturing sector in the domestic tariff area. While it is possible that investments reported in SEZs include a considerable amount of investment in infrastructure development, there is no evidence available currently on the split of investment into those by a developer and those by units. Further, there are no measurable indicators of the quality or quantity of infrastructure generated within the SEZs to allow for any analysis of this objective of the proposed policy. 1. There has been an expansion in the economic activity in the incentivized regions with their share in total output/value added as well as in capital and employment increasing over time. But the benefits have not accrued uniformly to all the incentivized states. Uttarakhand and Sikkim seem to have benefitted more than the other states.1 2. There is not much evidence of a large scale shifting of economic activity from the neighboring states to the incentivized states – since the level of activity did not decline in these states taken together. 3. On whether the states would witness sustained economic activity once the incentive period is over, evidence seems to suggest that the industry is footloose and hence a part of the economic activity might not be sustained once the incentives no longer exist. In other words, this scheme seems to be partially successful since it seems to have brought in some economic activity into some of the incentivized states. However, the fact that all incentivized states did not benefit equally suggests that these incentives need to be accompanied by other interventions to make these destinations attractive to the investor. Accelerated depreciation: This provision was introduced to encourage capital formation in the economy. As per the provisions in the Company’s Act, there are permitted rates of depreciation for different assets that a company might buy. The provision for accelerated depreciation allows companies to claim a higher rate of depreciation for some classes of assets when income is computed for purposes of determining the income tax liability. As is evident from the table on revenue foregone for India, the revenue foregone on account of accelerated depreciation is substantially higher than that associated with any of the other incentives provided. It should be noted that most of the other incentives can be availed by only a sub-group of taxpayers, but since investment is essential for every company to exist, accelerated depreciation can be claimed by all companies at some point in their lifecycle. In this sense, this incentive could be considered more equitable than other incentives. However, it is also important to note that these incentives might have two other consequences. First, since benefits for any tax exemption Research and Development (R&D): Companies operating in India are offered tax incentives in the form of super deduction for incurring revenue and capital expenses on R&D. There are different rates of deduction that are offered to companies undertaking in-house research and to those which outsource it. The question to ask in examining the success of this provision would be to ask if the potential benefits through R&D are being realized either by the economy or by the companies concerned. These benefits could be in terms of increase in income from intellectual property for the country or higher profits for companies which spend more on R&D expenditure. Rao et al. (2016) show that while there seems to be some evidence of an economy-wide relationship between the patents applied for and the increments in R&D expenses as well as total income from use 5
would be available only to companies which are profitable and potentially liable to pay tax, older companies by the mere fact of already being in operation at the time of capital investment, might be able to derive the benefits by claiming depreciation against incomes from pre-existing projects while the benefits to the newer companies would accrue only when profits are generated. In other words, the acceleration in depreciation provisions would be more easily available to older companies while for the new companies, the provision can only increase carry forward losses in the short run, which cannot be considered a benefit. Second and more important, these incentives coupled with perceived costs of hiring labour might induce the choice of more capital intensive technologies, which in turn would mean relatively lower levels of employment generation corresponding to given levels of capital formation. For a labour intensive economy where growth is perceived to be constrained by the availability of capital, incentives like these could be perceived as creating an undesirable bias in favor of capital. Figure 5: Fixed Asset per Worker across Factories classified according to NVA (INR million per Worker) 8 7 6 5 4 3 2 1 0 6.9 Fixed Asset per Worker (INR Million) 4.71 1.53 1.31 0.72 0.41 Upto 0.5 0.5 to 5 5 to 50 50 to 100 100 to 500 500 and above Net Value Added (NVA) Range (INR Million) Source: Computed from Annual Survey of Industries 2013-14 (CSO, 2016) “In order to make MSME companies more viable and also to encourage firms to migrate to company format, I propose to reduce the income tax for smaller companies with annual turnover upto ` 50 crore to 25%. As per data of Assessment Year 2015- 16, there are 6.94 lakh companies filing returns of which 6.67 lakh companies fall in this category and, therefore, percentage-wise 96% of companies will get this benefit of lower taxation. This will make our MSME sector more competitive as compared to large companies. The revenue forgone estimate for this measure is expected to be ` 7,200 crore per annum.” (Para 156) While empirically testing these hypotheses is beyond the scope of this policy note, it might be instructive to compare the capital labour ratio for different size classes of units to explore whether the suggested bias indeed is manifest in the observed information. The rationale for using a comparison across size classes is that larger units would demonstrate greater ability to find the resources to invest when compared to smaller units. Based on summary statistics of Annual Survey of Industries 2013- 14, Figure 5 presents fixed capital per worker for factories having increasing Net Value Added (NVA). It shows that for small (having NVA upto INR 0.5 million) and large (having NVA INR 500 and above) factories capital intensity is higher. High capital per worker for factories with low value added may be due to the fact that these factories are new entrants and yet to be under revenue stream. Since new factories (startups) invest substantially in capital stock though their outputs take time to reach the market place, fixed asset per worker is higher for them. Except for big factories, capital per worker is lower for medium factories as a result they cannot avail the benefits as much as big factories. There is no doubt that small companies face higher ETR than big companies and the reduction of CIT will help small companies. It is expected that lower tax rate may induce existing entrepreneurs to register their companies under the Indian Companies Act and also encourage potential entrepreneurs to start business. In the short run the reduction in statutory tax rate may benefit existing companies. Assuming PBT-Turnover ratio as 7%, companies up to INR 3.5 crore as annual PBT will be benefitted from the policy.2 Based on the information given the revenue foregone statement in the budget for 2017-18, the potential beneficiaries would be a staggering 50 percent of the total companies filing income tax returns. For these companies, the effective tax rate was over 30 percent for the year 2015-16.3 The above analysis suggests that one cannot unequivocally establish that tax incentives are an effective way of achieving the policy goals. Further, the benefits from incentives are not uniformly accessed by all companies – a larger proportion of benefits accrue to the larger and older companies. In the Union Budget 2016-17, the Finance Minister promised to reduce Corporate Income Tax rate to 25 percent with withdrawal of all exemptions. Though the government has set sunset clauses for some exemptions, there is no reduction of overall statutory CIT rate. This policy would have implications for both the government and the taxpayers. For the government, it would be pertinent to know if the revenue realization from corporate tax would be adversely affected by the change. On the other hand, for the taxpayer while the reduction in the statutory tax rate would be welcome, if it is accompanied by a reduction in the tax incentives as well, the net impact would vary depending on the extent of reliance on tax incentives. The net liability for some companies can increase, and these are likely to be large companies which tend to build a case for capital mobility in the face of increase in tax liability. In this context, it is pertinent to verify whether countries having 25% CIT provide tax incentives. We observe that Austria, China and Indonesia having CIT rate 25% and provide tax incentives. Austria provides tax incentives to private foundations, invention premium, and education allowance. China provides Section 5: pOLICY INITIATIVES OF THE GOVERNMENT In the Union Budget 2017-18 speech, the Finance Minister acknowledged that inequality exists in the effective tax rate of corporate tax for companies in India. He mentioned that “Medium and Small Enterprises (MSME) occupy bulk of economic activities and are also instrumental in providing maximum employment to people. However, since they do not get many exemptions, they end up paying more taxes as compared to large companies. As per data of financial year 2015-16, 2.85 lakh companies making profit of less than ` 1 crore pay effective tax rate of 30.26% while 298 companies making profit above ` 500 crores pay effective tax rate of 25.90%.” (Para 155) 6
development zones, remote areas including mineral-rich offshore areas. These raise questions on whether a regime of 25% tax with no exemptions would be sustainable in India or whether exemptions would creep in again over time. tax incentives to new high technologies, state debentures, approved agricultural, fishery, forestry projects, environmental protection projects, technology transfer, approved infrastructure projects and western regions. Indonesia provides tax incentives on account of tax holidays, accelerated depreciation, extended loss carry-forward for specific industries or locations, venture capital companies, export enterprises, bonded zones, economic Concluding remarks: The analysis in this paper attempts to provide an overview of the corporate tax rates and the regime of concessions and exemptions prevalent in India and explore the impact of the same on Indian corporate taxpayers. The analysis does suggest that incentives provide benefits differentially to the taxpayers with older and larger companies being better placed to avail the benefits provided. In other words, there is merit in the government’s stated goal of reducing the statutory tax rate to 25 percent along with a reduction in the tax incentives as well. However, the existence of incentives in many countries in the world, even in those that purportedly having a statutory tax rate of 25 percent also suggests that government might face some hurdles in achieving the stated goals if there are pressures of international tax competition with investors exploring alternative tax jurisdictions. In this context, an increase in protectionism in the international climate might provide a window of opportunity where the pressures of international tax competition are blunted. It should however be kept in mind that tax incentives do re-enter tax structures over time and the effort to keep them out or to periodically clean the tax regime needs to be an ongoing effort. Towards this end, periodic assessments of the cost and benefits of tax incentives might provide the necessary information to weed out ineffective incentives if any. 7
Appendix Effective tax rate, inclusive of surcharge and education cess, of sample companies across Industry Effective Tax Rate (in %) INDUSTRY Total Tax (in Rs. Crore) No. of Companies Profit Before tax (in Rs. Crore) s. no. Sector 1 Agro-Based Industries 9,925 11,160 2,934 26.3 2 Auto Mobiles and Auto Parts 4,596 48,663 14,621 30.0 3 Cement 639 10,223 2,183 21.4 Diamond Cutting 4 475 2,260 662 29.3 5 Drugs and Pharmaceuticals 5,568 58,142 14,053 24.2 6 Electronics including Computer Hardware 2,427 13,074 4,646 35.5 7 Engineering Goods 9,806 35,066 10,303 29.4 8 Fertilizers, Chemicals, Paints 3,809 21,551 6,146 28.5 9 Flour and Rice Mills 1,552 740 235 31.7 10 Food Processing Units 3,374 9,549 3,078 32.2 11 Marble and Granite 2,022 1,059 359 33.9 Manufacturing Sector 12 Paper 1,351 2,203 514 23.3 13 Petroleum and Petrochemicals 662 74,104 16,909 22.8 Power and Energy 14 5,408 52,723 11,555 21.9 15 Printing and Publishing 2,593 6,527 1,968 31.4 16 Rubber 898 1,021 326 31.9 17 Steel 4,188 11,668 2,832 24.3 18 Sugar 331 1,273 246 19.3 19 Tea, Coffee 1,030 1,821 416 22.8 20 Textiles, Handlooms, Power Looms 9,773 14,909 4,009 26.9 21 Tobacco 274 17,330 5,446 31.4 22 Tyre 151 7,412 2,029 27.4 23 Vanaspati And Edible Oils 631 2,215 521 23.5 Others 24 52,580 1,87,849.6 47,156 25.1 25 Chain Stores 668 1,182 400 33.9 Trading 26 Retailers 17,168 5,971 1,701 28.5 27 Wholesalers 25,707 10,798 3,698 34.2 28 Others 90,732 27,213 7,517 27.6 29 General Commission Agents 4,136 980 297 30.3 Commission Agents 30 Builders 18,965 7,968 2,217 27.8 31 Estate Agents 3,671 285 81 28.4 Builders 32 Property Developers 29,269 17,395 4,324 24.9 33 Others 19,975 3,437 876 25.5 Civil Contractors 34 10,913 13,844 4,268 30.8 Contractors 35 Excise Contractors 28 9 3 35.9 8
Appendix Effective tax rate, inclusive of surcharge and education cess, of sample companies across Industry Effective Tax Rate (in %) INDUSTRY Total Tax (in Rs. Crore) No. of Companies Profit Before tax (in Rs. Crore) Sector s. no. Forest Contractors 36 9 308 116 37.6 Contractors Mining Contractors 37 88 3,264 919 28.2 Others 38 11,640 6,796 2,347 34.5 Chartered Accountants, Auditors, etc. 39 86 3 1 30.2 40 Fashion Designers 88 35 9 26.7 Professionals Legal Professionals 41 340 32 10 29.6 Medical Professionals 42 1,884 403 122 30.3 Nursing Homes 43 1,048 282 91 32.1 Specialty Homes 44 1,390 1,772 557 31.4 Others 45 5,953 1,255 424 33.8 Advertisement Agencies 46 3,152 2,000 695 34.7 Beauty Parlors 47 370 28 9 33.2 Consultancy Services 48 19,278 12,170 3,076 25.3 Courier Agencies 49 563 557 232 41.7 Computer Training/ Educational and Coaching Agencies 50 3,688 1,277 404 31.7 51 Forex Dealers 940 365 116 31.9 Hospitality Services 52 5,169 1,636 512 31.3 Service Sector Hotels 53 6,875 2,694 739 27.4 I.T. Enabled Services Providers, BPO Service 54 16,051 55,331 16,244 29.4 Security Agencies 55 2,119 739 288 38.9 Software Development Agencies 56 13,136 100,122 24,528 24.5 57 Transporters 4,740 9,037 2,389 26.4 Travel Agents, Tour Operators 58 4,902 1,323 447 33.8 Others 59 74,399 93,852 27,813 29.6 Banking Companies 60 233 102,224 41,158 40.3 Chit Funds 61 2,742 510 160 31.3 Financial Institutions 62 570 10,191 3,861 37.9 Financial Service Providers 63 2,545 9,995 2,997 30.0 Financial Service Sector Leasing Companies 64 514 2,582 545 21.6 Money Lenders 65 323 160 39 24.6 Non-Banking Finance Companies 66 8,470 70,830 20,781 29.3 67 Share Brokers, Sub-brokers etc. 3,658 10,057 2,520 25.1 68 Others 15,949 39,259 10,999 28.0 9
Appendix Effective tax rate, inclusive of surcharge and education cess, of sample companies across Industry Effective Tax Rate (in %) INDUSTRY No. of Companies Profit Before tax (in Rs. Crore) Total Tax (in Rs. Crore) s. no. Sector 69 Cable T.V. Productions 414 260 78 30.1 70 Film Distribution 355 1,615 566 35.1 71 Entertainment Industry Film Laboratories 43 11 3 26.4 Motion Picture Productions 72 709 896 318 35.5 73 Television Channels 393 4,671 1,343 28.8 74 Others 4,538 3,440 899 26.1 75 Others 32,433 34,130 11,087 32.5 Others 597,884 1,267,408 357,968 28.2 TOTAL REFERENCES Notes Government of India, (2009), “Budget 2009-10”, Government of India, New Delhi. 1 In an another study, Kolhe (2017) concludes that “only Himachal Pradesh, Uttarakhand and Sikkim show development as a result of the policy [tax incentive policy] and even this development has taken place only in pockets. The policy has failed to give fillip to development in the seven North-eastern states.” Central Statistics Office, (2016), “Annual Survey of Industries 2013-2014: Summary Results for Factory Sector”, Ministry of Statistics and Programme Implementation, Government of India, Kolkata. 2 According to Annual Survey of Industries average ‘Profits’ to ‘Gross Value of Output’ ratio was 0.069 during 2011-12 to 2013-14. Kolhe, Piyush, (2017), “Tax Incentive Policy for Development of Himalayan and North- eastern States in India”, Indian Journal of Public Administration, Vol. 63, No. 1, pp. 136-156. 3 The actual beneficiaries may be somewhat lower since to avail of this scheme, the companies have to satisfy certain conditions. Lower tax rate is applicable if companies - (a) do not claim profit linked or investment linked deductions and (b) do not avail of investment allowance and accelerated depreciation. OECD, (2010), “Tax Expenditures in OECD Countries”, OECD: Paris. PricewaterhouseCoopers, (2016), “International Comparison of Effective Corporate Tax Rates”, September 2016. Rao, R. Kavita, S. Tandon and S. Mukherjee, (2016), “Corporate Tax: A brief assessment of some exemptions”, Working paper No. 165, National Institute of Public Finance and Policy (NIPFP), New Delhi, March 2016. author: R. Kavita Rao and Sacchidananda Mukherjee inputs: Nisha Agrawal, Diya Dutta and Ranu Kayastha Bhogal © Oxfam India, December 2017 This publication is copyright but the text may be used free of charge for the purposes of advocacy, campaigning, education, and research, provided that the source is acknowledged in full. The copyright holder requests that all such use be registered with them for impact assessment purposes. For copying in any other circumstances, permission must be secured. E-mail: sakti@oxfamindia.org. Oxfam India, a fully independent Indian organization, is a member of an international confederation of 20 organizations. The Oxfams are rights-based organizations, which fight poverty and injustice by linking grassroots interventions to local, national, and global policy developments. Oxfam India | 4th and 5th Floor, Shriram Bharatiya Kala Kendra, 1, Copernicus Marg, New Delhi 110001 Tel: +91 (0) 11 46538000 | Web: www.oxfamindia.org Oxfam India is a member of a global confederation of 20 Oxfams and is registered as a company under section 8 of the Indian Company Law. 10