Download
1 / 11
150 likes | 740 Vues
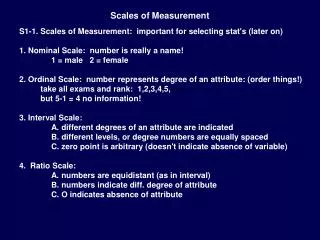
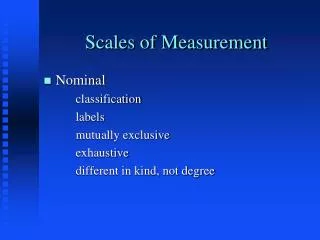
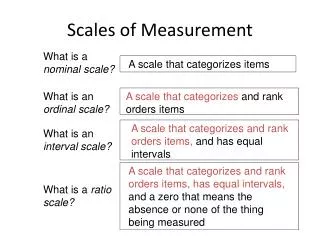
Scales of Measurement 1. Nominal Scale - consists of levels or categories , labels or names identify the categories - strictly , no measurement is involved - categories are usually coded 1, 2, 3, and so on, only to facilitate counting.

E N D
Scales of Measurement • 1. Nominal Scale - consists of levels or categories , labels or names identify the categories • - strictly, no measurement is involved • - categories are usually coded 1, 2, 3, and so on, only to facilitate counting. • - the only valid computations for nominal data are counts, proportions or percentages
Examples: • The variable Gender of Student • Two levels – Male or Female (labels). - levels maybe coded 1 for Male and 2 for • Female or 0 for Male and 1 for Female. • 2. The variable Religious Affiliation may consist of the following categories: Catholic, Iglesia Ni Cristo, Muslim, Christian, Seventh Day Adventist, etc
2. Ordinal Scale • - specific order or rank among the • categories • - no measurement is strictly done • - the codes assigned to the categories • - reflect a scale that depends on the purpose of the study • the numbers used as codes for the categories are assigned arbitrarily • analysis of ordinal data consists of computing for the median, mode and many nonparametric tests
1. The variable Rating on a Juice Taste-Test may take 5 possible categories. • Superior = 5 • Good = 4 • Average = 3 • Poor = 2 • Inferior = 1 • Note that the codes assigned maybe, 2 for Superior, 1 for Good, 0 for Average, - 1 for Poor and – 2 for Inferior.
2. Opinion of government policy on Reproductive Health • Strongly Agree = 5 Agree = 4 • Undecided = 3 • Disagree = 2 • Strongly Disagree = 1 • 3. The variable Response of Viewers to a TV Program
Interval Data - consists of values which • are numeric • - the values can be ranked • - distance between values is constant • - the value, zero is arbitrary in nature • analysis on means and variances are possible
Examples: • The variable Atmospheric Temperature (in degree Celcius) in one day may show the following data. • Manila 35 • Baguio 25 • Tagaytay 28 • Cagayan de Oro 30 • We can say that it is 10o C warmer in Manila than in Baguio or 10 oC colder in Baguio than in Manila.
Note that value 0 oC does not represent the absence of heat but it only means that it is very, very cold. • 2. The variable Scores on NSAT test • The variable Arrival Time at which the flight of Philippine Airlines arrives at NAIA from Cebu
Ratio Data - consists of values which are • numeric • - the values can be ranked • - distance or difference between values • is defined as a constant • - the value zero or origin denotes the • absence of the characteristic being • measured • - analysis on means and variances are • possible
Examples: • 1. The variable Annual Income of a Family (in pesos) takes a ratio data. If Family A earns P 60,000 and Family B earns P 120,000, then we say that Family B earns twice as much as Family A. • 2. The variable Weight of a Patient takes a ratio data. If Patient 1 weighs 145 pounds and Patient 2 weighs 120 pounds, then we say, Patient 1 weighs 25 pounds more than Patient 2.
3. The variable Number of Years doctors spend in medical practice • Number of cars sold last month by salespeople