Download
1 / 21
280 likes | 880 Vues
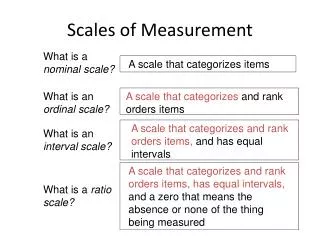
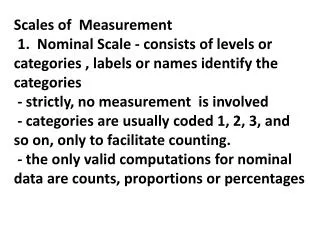
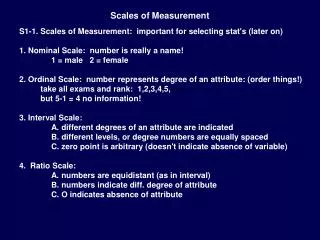
Scales of Measurement. S1-1. Scales of Measurement: important for selecting stat's (later on) 1. Nominal Scale: number is really a name! 1 = male 2 = female 2. Ordinal Scale: number represents degree of an attribute: (order things!) take all exams and rank: 1,2,3,4,5,

E N D
Scales of Measurement S1-1. Scales of Measurement: important for selecting stat's (later on) 1. Nominal Scale: number is really a name! 1 = male 2 = female 2. Ordinal Scale: number represents degree of an attribute: (order things!) take all exams and rank: 1,2,3,4,5, but 5-1 = 4 no information! 3. Interval Scale: A. different degrees of an attribute are indicated B. different levels, or degree numbers are equally spaced C. zero point is arbitrary (doesn't indicate absence of variable) 4. Ratio Scale: A. numbers are equidistant (as in interval) B. numbers indicate diff. degree of attribute C. O indicates absence of attribute
45 0 of 5 Which one is nominal? • The number of cigarettes a person smokes in a day • Level in school: freshman= 1, sophomore=2, etc. • Age in years 4. How happy are you? none 0 ------5 --------10 Lots
45 0 of 5 Which one is ratio? • Blood pressure level • Heart beat rate • Age in years • Number of dates one had last week • The number of hours of TV watched in a month • All of the above • None of the above • I haven’t the faintest!
Shavelson – Descriptive Statistics Chapter 3 Objectives (Much of this will also be conducted using SPSS in the lab) Given data, be able to: create a data matrix create a frequency distribution make sure you brush up on graphing in general (54) then, given data, be able to create a histogram, and frequency polygon (54-57) know the difference between symmetric and skewed distributions (positively and negatively), as well as unimodal and bimodal distributions (60) calculate and create a relative and cumulative frequency distribution (and graph it). This requires that you can calculate relative frequency (which is a proportion) and cumulative proportions and percentages (62-66). Given a percentile score, be able to explain what it means; given a cumulative percentage distribution (e.g. figure 2-7), be able to tell what percentile a raw score lies at, or given a percentile, give the raw score correlated to that percentile (67-68).ge in a single-participant design (398-401).
Shavelson – Descriptive Statistics Shavelson Chapter 4 Mode: most frequently occurring score Median: the score dividing the distribution in half (50th percentile) Mean: the “center of gravity”; scores above mean balances with those below Relationship among measures of Central Tendency • Mode: least stable. Good for quick estimates • Median: use for asymmetric distributions (best measure of central tendency on skewed) • Mean most commonly used; useful for inferential stats (but extreme scores influences mean more)
45 0 of 5 What is the mean of 22, 18, 24, 26, 10 • 27 • 19 • 21 • 20 • 24
45 0 of 5 What is the median of 33, 17, 25, 20, 35 • 33 • 17 • 25 • 20 • 35
45 0 of 5 What is the mode of 19, 23, 54, 23, 29 • 27.5 • 19 • 26 • 24 • 23
Shavelson – Descriptive Statistics Variability Hi score – low score = Range Variance (square of SD) SD = the average deviation from the mean ∑(X – X)2 = standard deviation N-1
Shavelson Chapter 5 S5-1. Define, be able to create and recognize graphic representations of a normal distribution (115-121). Normal distribution: Provides a good model of relative frequency distribution found in behavioral research.
Shavelson Chapter 5 S5-2. Know the four properties of the normal distribution (120-121). Unimodal, thus the greater the distance a score lies from the mean, the less the frequency of at score. Symmetrical Mean, mode, and median all the same Aymptotic line never touches the abscissa Note that the mean and variance can differ, thus “a family of normal distributions”
Shavelson Chapter 5 S5-3. You should know what is meant by the phrase “a family of normal distributions” (121,3). I will also cover in class the general issues of “distributions” which are frequently used in statistical analyses. From:http://www.gifted.uconn.edu/siegle/research/Normal/instructornotes.html
45 0 of 5 • These distributions have the same mode, different median and SD • These distributions have different mode, same median, different SD • These distributions have different means, modes and variances • These distributions have the same mode, mean and median, but different SDs
45 0 of 5 • These distributions have the same mean, but different SDs • These distributions have a different means and medians, but the same modes and SDs • These distributions have different means, modes, and • Nothing is the same with these two!
Shavelson Chapter 5 S5-4. Know the areas under the curve of a normal distribution (roughly, e.g. 34.13%, 13.59%, 2.14 % and .13% on either side of the mean) From:http://www.gifted.uconn.edu/siegle/research/Normal/instructornotes.html
Shavelson Chapter 5 S5-5a. What is a standard score (z-score) (123,3)? Be able to calculate the z-score, given a raw score, mean, and standard deviation. Z score = X-mean S X = raw score Mean = mean of distribution S = standard deviation Notice that to calculate the Z score you need the mean and S of a distribution of scores.
Shavelson Chapter 5 S5-5b. What two bits of information does the z-score provide us (125, 1-2)? Z scores provides the following information: • Size of Z scores indicates the number of standard deviations raw score is from the mean • Sign (+ or -) indicates if the raw score is above the mean (+) or below the mean (-)
45 0 of 5 A z score of -1.8 means… • The mean of the distribution is 1.8 • The distribution is skewed • The raw score lies 1.8 means above the mean • The raw score lies 1.8 standard deviations below the mean • The raw score 1.8 lies standard deviations above the mean
Shavelson Chapter 5 • Know the three characteristics of a distribution of z-scores summarized as (125): • Mean=0 • Std. Dev. And Variance=1 • The shape of a z-score distribution will be the same as the original frequency distribution.