Download
1 / 14
780 likes | 6.24k Vues
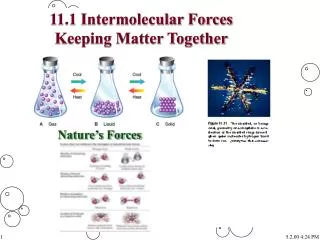
Freezing and Boiling Point Graph aka Phase Change Diagram or Heating/Cooling Curve. Energy (J). Energy (J).

E N D
Freezing and Boiling Point Graphaka Phase Change Diagram or Heating/Cooling Curve Energy (J)
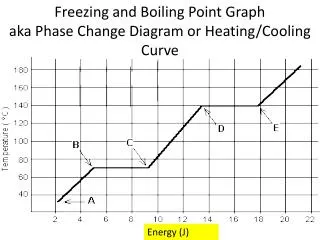
Energy (J) This diagram shows the melting and boiling points for a crystalline substance. Temperature is on the y- axis & either the amount of energy absorbed or released or the time is graphed on the x-axis.
Energy (J) Between the temperatures represented by points A and B, the substance will exist in a solid state. As heat is added the particles will vibrate faster & thus have an increase in kinetic energy & an increase in temperature.
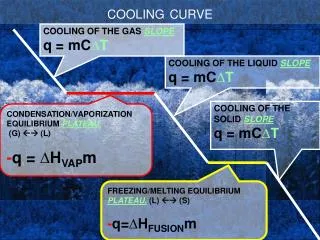
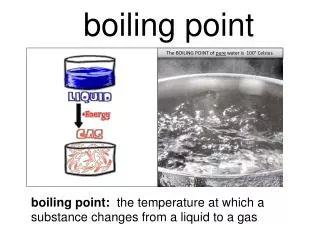
What is the melting point of this substance? Energy (J) The temp represented by B is the melting point of the substance. The flat line indicates that heat is being added (absorbed), but the temp is not increasing, thus there is no change in KE between points B and C. At time B, the substance is all solid. At time C, the substance will be all liquid. The energy needed to change the substance from a solid to a liquid is called “heat of fusion” (Hf).
Energy (J) At Point C, the KE begins increasing and continues to increase until the substance reaches its boiling point, represented by point D. Since temperature is directly related to KE, the temperature is also increasing during segment CD.
What is the boiling point of this substance? Energy (J) At point D, the liquid begins to boil and changes into the gaseous state. The energy needed to change the liquid to a gas is called “Heat of vaporization” (Hv). During segment DE the substance is both liquid and gas. At point E, all of the liquid has become a gas and the KE begins increasing as indicated by the positive slope of the line. An increase in KE means an increase in temperature and an increase in speed of particles.
Label each segment as being either solid, liquid, gas, solid and liquid, liquid and gas Label each horizontal segment as either melting or vaporation Label each horizontal segment as either freezing or condensating.
When reading this graph backwards, energy is being released instead of being absorbed. Segment ED represents the condensation point (substance is changing from a gas to a liquid) and segment CB represents the process of changing from a liquid to a solid (freezing). This means the freezing point and melting point is the temperature.
When reading this graph backwards, what is the freezing point of the substance? What is happening during segment CB? What is the condensation point of the substance? What is happening in terms of kinetic energy during segment DC?
F G H I J This is the same graph drawn backwards. When reading this graph, what is the freezing point of the substance? What is happening during segment HI? What is the condensation point of the substance? What is happening in terms of energy?
Gas Liquid and Gas Evaporation Condensation No Change in KE or Temp Liquid Temp and KE Increasing Solid and Liquid Melting Freezing Solid
Only crystalline solids will have definite melting and boiling points as illustrated on the previous graphs. Crystalline substances have definite melting and boiling points because those substances have a very orderly arrangement of atoms. Amorphous substances do not have a definite melting or boiling point because their atoms do not have an orderly arrangement. Examples of crystalline substances: ice, salt, alcohols, quartz, sugar Examples of amorphous substances: plastics, rubber, glass, cement, tar Tutoring, Physics, Physics Tutoring, Mechanics of Solids and Fluids, Elasticity, Stoke's Law, Bernoulli's Theorem, Surface Tension, Hydraulic Press, Hooke's law, Pascal's law, Archimede's Principle - Tutorvista.com
Crystallization and solidification can be considered synonyms for freezing. For crystalline substances, melting point and freezing point will be the same temperature and boiling point and condensation point will be the same temperature. Sublimation is the process of changing from a solid to a gas without going through the liquid state