Download
1 / 7
70 likes | 194 Vues
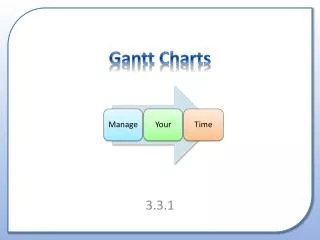
Gantt Charts simplify project management by visually representing tasks, timelines, and dependencies. They provide a user-friendly alternative to CPA diagrams, helping project managers plan efficiently. Each chart displays milestones, resources involved, task statuses, and the interdependencies between tasks. For instance, in teaching syllabus topics, Gantt Charts illustrate the duration allocated for each subject while highlighting the need to complete previous topics before advancing. These charts enhance clarity and organization, making it easier to monitor and manage project progress.

E N D
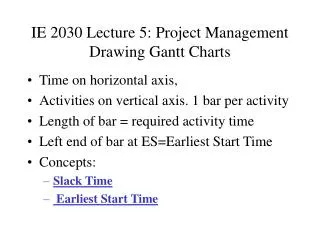
Introduction • We already know that managing a project can be a difficult task. • There are a lot of things that need to happen before a system is ready to ship out. • We have looked at how CPA diagrams can help us understand what tasks need to be completed and in which order...but sometimes these can be a more of a burden to use. • Gantt Charts offer most of the same information in a more user friendly way.
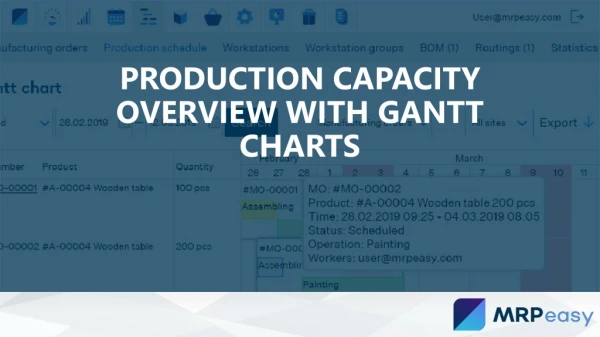
What is a Gantt Chart? This chart helped me plan when and how I was going to teach each topic from The Systems Cycle chapter of the syllabus.
What is a Gantt Chart? This red line shows the total length of the syllabus topic. The blue bars show how much time would be given to each sub-topic. These blue linking bars show that each topic is dependant on the completion of the previous topic.
What is a Gantt Chart? • It is a model which shows: • Milestones: • Important checkpoints within a project. • Resources: • Some charts have additional information which shows who will be working on a particular task.
What is a Gantt Chart? • It is a model which shows: • Status: • You can include % complete lines which overlap the task bar. When a task is complete the line should completely overlap a task. • Dependencies: • If a task is dependant on the completion of a previous task then this can be indicated by linking the task bars.
Try this... • When we looked at Critical Path Analysis you had to make a cup of tea... • Make a Gantt Chart for the same process. A B D E G 2 min Boil kettle 1 min Pour water into pot 2 min Brew tea 1 min Fill kettle C F 1 min Put tea bag in tea pot 1 min Get mugs ready