Gantt Charts
Gantt Charts. Caroline Daly Niall Geary Tom Walsh . Henry Laurence Gantt, an American mechanical engineer, is credited with the invention of the Gantt chart in the 1910’s.

Gantt Charts
E N D
Presentation Transcript
Gantt Charts Caroline Daly Niall Geary Tom Walsh
Henry Laurence Gantt, an American mechanical engineer, is credited with the invention of the Gantt chartin the 1910’s. He designed his charts so that foremen or other supervisors could quickly know whether production was on schedule, ahead of schedule, or behind schedule.
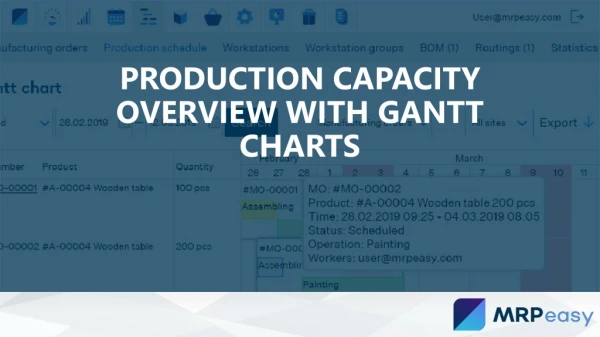
Definition of a Gantt Chart A Gantt chart is a graphical representation of the duration of tasks against the progression of time. Gantt Chart is a process control chart or a graphical representation that illustrates work plans and schedules by using horizontal bars and is used for production management or project management. A Gantt chart is a type of bar chart that illustrates a project schedule. Gantt charts illustrate the start and finish dates of the terminal elements and summary elements of a project. Terminal elements and summary elements comprise the work breakdown structure of the project.
Gantt Charts • Gantt chart is a popular type of bar chart. Gantt Charts illustrate the tasks that must be done to complete the project, the time frame they must be completed in, and the team members who are assigned to each task. • In the Gantt chart, each task takes up one of the rows. Dates run along the top in increments of days, weeks or months. Rows of bars in the Gantt chart show the start and finish dates of each task in the project. Tasks may run sequentially, in parallel or overlapping. • Since the initial introduction of Gantt charts, they have become an industry standard as a key project management tool for representing the phases, tasks and activities that are scheduled as part of a project work breakdown structure or timeline of activities.
Gantt Charts • Gantt charts indicate the exact duration of specific tasks, but they can also be used to indicate: • The relationship between tasks • Planned and actual completion dates • Cost of each task • The person or persons responsible for each task • The milestones in a project's development • Gantt charts are also used by supervisors and team leaders to schedule team members for various time dependent tasks such as visiting clients, making sales calls, being on medical call, being on guard duty, and more.
Gantt Charts - Pros • Gantt Charts are an excellent presentation tool for illustration purposes. • Resource Planning: They allow you to plan the allocation of resources needed to complete the project. • Critical Path Analysis: Help you to work out the critical path for a project where you must complete it by a particular date. • Monitoring tool for tracking progress: Once a project is under way, Gantt Charts allow one to assess how long a project should take, determine the resources needed, and lay out the order in which tasks need to be carried out, thereby enabling one to continuously monitor the progress of the project.
Gantt Charts - Pros • Monitoring tool which displays when action needs to be taken: Gantt Charts enable one to immediately see what should have been achieved at a point in time, and one can therefore take remedial action to bring the project back on course. This can be essential for the successful and profitable implementation of the project. • Display options: They can be used in status reporting to show how much of the plan has been completed by displaying the progress of an activity can be displayed in many formats; a parallel bar, or using colour etc
Gantt Charts - Cons • Estimates must be completed before the chart can be drawn. • It is difficult to show two sets of dates when using techniques such as earliest start date and latest start. • Changes to the schedule require a redrawing of the chart. • Several scheduling possibilities cannot be shown in the same chart. • Resource assignments are not easy to illustrate. • A Gantt chart does not effectively address the dependencies between jobs • Dependencies are hard to verify.