Practice Profiles
Dr. John Battersby, Medical Director at ERPHO, discusses the increasing demand for practice-level data to drive quality in primary care. He highlights the policy focus on performance and the development of tailored approaches by PCTs, such as the Tower Hamlets Balanced Scorecard. The presentation covers various primary care data sources, challenges in accessing data, and the role of the Quality and Outcomes Framework (QOF) and Quality Management Analysis System (QMAS). It also previews the upcoming national practice profiles to be rolled out by APHO.


Practice Profiles
E N D
Presentation Transcript
Practice Profiles Dr John Battersby Medical Director, erpho
Background • Increasing need for practice level data • Policy focus on primary care – especially quality and performance • PCTs developing their own approach (e.g. Tower Hamlets Balanced Scorecard)
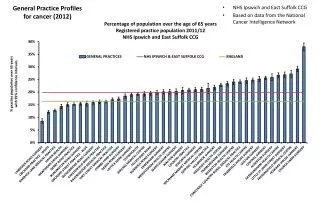
Primary care data sources • Practice systems • Not easily accessible • “Commercial” databases (QResearch and THIN) • GPES (hopefully not Godot!) • Quality and Outcomes Framework (QOF) • Introduced in 2004 • 129 indicators included in 2008-09
QOF • Intended to drive up quality • Not a performance management tool • Underpinned by QMAS – Quality Management Analysis System (Connecting for Health) • QOF/QMAS use same coding system as primary care clinical systems: Read Coding
Other tools • Primary Care Commissioning Support Tool (http://www.pcc.nhs.uk/572 ) • Primary Care Contracting Quality and Productivity Calculator (http://www.pcc.nhs.uk/primary-care-quality-and-productivity-challenge ) • SHAPE Tool (http://www.nepho.org.uk/topics/SHAPE%20-%20Strategic%20Health%20Asset%20Planning%20and%20Evaluation ) • NHS Comparators (http://www.ic.nhs.uk/nhscomparators )
Practice Profiles • 3 PHOs have developed profiles (LHO, YHPHO and ERPHO) • All similar in terms of content • Underlying handling of data is different • APHO currently working on roll out of profiles across all PHOs in England
Content • Population • Demography & Patient Satisfaction • Cardiovascular disease • Diabetes • Mental health • Respiratory disease • Secondary care use • Prescribing • Other
Display • Population graphs/charts (LHO/ERPHO) • Spine charts (all) • Maps (YPHO) • Radar charts (YHPHO for geodemographic segmentation) • YHPHO include ‘clustering’
Challenges • Getting data (other than QOF) • Practice populations • Exeter NSTS • Attribution Dataset – GP lists reconciled with ONS resident populations • Practices have no geography so geographically defined indicators (like IMD) cause problems
The future? • Hopefully roll out of APHO national practice profiles in autumn (October) – subject to early access to QOF data • APHO profiles will be based on ERPHO model – printability and ability to cluster practices are important • Unclear how profiles might link/integrate into other products
Questions? john.battersby@erpho.org.uk