Download

1 / 82
820 likes | 1.01k Vues
The Ontario Electricity Market 1 Year in. Richard Penn Mgr - Market Assessment The IMO. Agenda. Introduction - brief overview Market Design Issues Identified in the MSP reports. IMO. www.theimo.com. The IMO Web - Today’s market. The IMO - As Operator of Reliable System.

E N D
The Ontario Electricity Market 1 Year in Richard Penn Mgr - Market Assessment The IMO
Agenda • Introduction - brief overview • Market Design • Issues Identified in the MSP reports
IMO www.theimo.com
The IMO - As Operator of Reliable System We balance generation to meet constantly changing demand for electricity: • Monitor conditions on IMO-controlled grid • Schedule production from suppliers • Maintain reliability to industry standards
The IMO - As Impartial Market Administrator We ensure accountability: • Authorize/register participants • Run commercial activities of market We ensure equal, unbiased access: • Provide historical and forecast performance data • Monitor conduct of participants – fair competition, level playing field
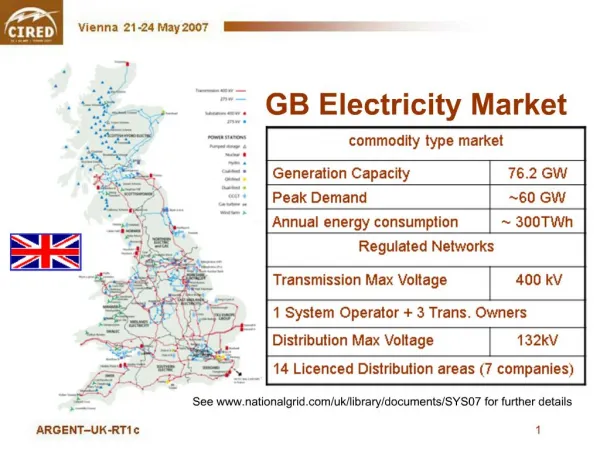
Some Facts Ontario has set a new Peak Demand of 25,414 Mw Aug 13, 2002 Ontario has set a new Monthly Energy Consumption of 14,500 Gw-hrs Imports at times totaled over 4000 Mw an hourAverage energy price since May 1 58.42 $/Mw-hr Average Weighted energy price since May 1 62.50 $/Mw-hrMinimum Hourly Price was 7.84 $/Mw-hrMaximum Hourly Price was 1036.80 $/Mw-hr
The Ontario Demand for the first year of the market is about 156 Tw-hrClose to 10 B$ has been settled through the IAM marketsMore than 136,000 Settlement Statements will have been issued by April 30, 2003100% of Settlement Statements issued on time, so far 99.6% of Settlement Statements issued to date were error free
Simple Energy Spot Market Energy Suppliers Energy Purchasers IMO - Administered Markets Offers Bids Real-time Energy Offer Energy amount and price offered for each hour of the dispatch day, for each dispatchable supply facility Bid Energy amount and price required for each hour of the dispatch day, by each dispatchable load facility • The market clears where the offer and bid curves intersect. This determines the: • market clearing quantity and • market clearing price (MCP)
Financial Physical Real-time Operating Reserve Energy Procurement Ancillary Services Transmission Rights The Present Market IMO - Administered Markets
Who Can Participate in the Markets • Anyone can apply to become a registered market participant • Anyone who wishes to inject energy into, or withdraw energy from the IMO-controlled grid MUST become a Market Participant
Direct Large Customer Generator Participants Outside Ontario Who Can Participate? Embedded Large Customer EmbeddedGenerator Distributor
Simplified Energy Market Offers and Bids
Generators and Imports Loads and Exports Offers Bids Bid and Offer Basics IMO - Administered Markets Real-time Energy
Market Clearing Price Market Clearing Price Demand Supply MCP Price Quantity
Market Design Principles • The price of energy at each time and place should reflect the marginal cost of producing or not consuming one more unit of energy (at that time and place) • Dispatchable market participants should be compensated for the effects of constraints
Generator 1 Generator 3 50 MW - $38/MWh 100 MW - $15/MWh 50 MW - $25/MWh Generator 2 50 MW - $20/MWh Setting the Market Clearing Price - An Example
Offers Are Selected Economically Quantity 50 MW $38 / MWh 50 MW $25 / MWh 50 MW $20 / MWh 100 MW $15 / MWh 20:00 12:00 13:00 14:00 15:00 16:00 17:00 18:00 19:00 Time Generator 1 Generator 2 Generator 3
Offers and Demand Quantity 250 MW $38 / MWh 200 MW $25 / MWh 150 MW $20 / MWh 100 MW 50 MW $15 / MWh 20:00 12:00 13:00 14:00 15:00 16:00 17:00 18:00 19:00 Time Generator 1 Generator 2 Generator 3
MCP $ / MWh 25 25 25 25 25 25 25 38 38 38 38 38 Offers and Demand - 5 Minute Intervals Quantity 50 MW $38 / MWh 50 MW $25 / MWh 50 MW $20 / MWh 100 MW $15 / MWh 16:20 16:25 16:50 16:55 17:00 16:00 16:05 16:10 16:15 16:30 16:35 16:40 16:45 Time Generator 1 Generator 2 Generator 3
Comparison of a July to an October Domestic Offer Curve Difference is due to Outages
The Unconstrained schedule determines a uniform Market Clearing price ( MCP) and assumes Ontario is a copper plate where all generation can flow to all loads The Constrained schedule which determines the actual dispatched output for each generator to meet the physical limitations of the Transmission System The difference is schedules can result in a Constrained Payment Now it Gets ComplicatedIn the Ontario Design there are actually two schedules for each generator
MCP - Copper Plate Generator 1 100 MW $15 Load 190 MW Generator 2 100 MW $20 Generator 3 100 MW $25 No transmission line limit • Requirement is • 190 MW • Gen 1: 100 MW • Gen 2: 90 MW • Gen 3: does not run • MCP $20 Region 1 Region 2
East-West Tie Quebec North Flow North/ Flow South Minnesota Quebec South Manitoba FETT New York QFW East Michigan BLIP New York Niagara Physical Limitations • Bid/Offer selection must result in system flows within system’s physical limitations • Increases the cost of power to ensure reliability
Transmission Congestion Generator 1 100 MW $15 Load 190 MW Generator 2 100 MW $20 Generator 3 100 MW $25 150 MW transmission line limit • Requirement is • 190 MW • Gen 1: 100 MW • Gen 2: 50 MW • Gen 3: 40 MW • MCP $20 determined from Unconstrained Schedule Region 1 Region 2
Unconstrained vs ConstrainedReminder • Unconstrained schedule determines prices • Constrained schedule determines dispatch instructions • Any differences between unconstrained and constrained schedule creates potential for CMSC
Constrained Payments for the 1’st Year of the Market • Constrained on Payments = about 75M$ • Constrained Off Payments = about 132 M$
The Actual Constrained Schedule takes into account - Available Transmission- Transmission Limits- Losses - Generator Capabilities such as Ramp rates -Actual generator Output
Now it Gets More complicated • Algorithm simultaneously solves for energy and three classes of OR • whether a generator is in the energy market or is “switched” to the OR market they are held whole to their operating profit. • Requirement for OR determined by IMO, based on industry standards
Operating Reserve • Three classes of Operating Reserve • 10 minute spinning - 25% of the largest single contingency • 10 minute non-spinning - 75% of the largest single contingency • 30 minute - 1/2 of the second largest contingency
Operating Reserve Who can offer OR? • Dispatchable Loads • Dispatchable Generators • Importers and Exporters ( Injections / Off-takes)
Offer Basics - Operating Reserve Markets Energy Suppliers Energy Purchasers IMO - Administered Markets OROffers OROffers Operating Reserve Offer Operating Reserve amount and price offered for each hour of the dispatch day • Classes of OR Markets • 10 min spinning • 10 min non-spinning • 30 min
Optimization Objective Value of Electricityproduced …as indicated by Energy demand from non-dispatchable loads and Energy bids Cost toproduce Electricity …as indicated by offers to supply Energy & Operating Reserve Economic gain from trade - = Algorithm maximizes economic gain from trade for all market participants
Further ComplicationsInterjurisdictional Trade Similar to trade by resources inside Ontario • Everyone must bid and offer to be scheduled • Scheduling is independent of any bilateral contracts • No physical transmission rights • Uplifts apply to exports (some exceptions)
Interjurisdictional Trade Some differences from resources in Ontario • Zonal pricing • Scheduled hourly • Bid and offer from Boundary Entity Resources
Interjurisdictional Trade Quebec (8) Manitoba Minnesota New York Michigan