Population and Malthus
460 likes | 771 Vues
Population and Malthus. Demographic Transition. greater industrialization – lower birth rate and higher mortality rate until natural increase or growth rate is either zero or negative numbers You can tell the level of industrialization by looking at population pyramids. Stage 1. Stage 2.

Population and Malthus
E N D
Presentation Transcript
Population and Malthus Demographic Transition
greater industrialization – lower birth rate and higher mortality rate until natural increase or growth rate is either zero or negative numbers You can tell the level of industrialization by looking at population pyramids Stage 1 Stage 2 Stage 3 Stage 4 Birth rate Natural increase Death rate Time Note: Natural increase is produced from the excess of births over deaths. 4 stages based on level of IndustrializationLevel one the least industrialized to Level 4 the most industrialized
Births/Deaths per 1,000 1750 Sources: B.R. Mitchell, European Historical Statistics 1750-1970 (1976): table B6; Council of Europe, Recent Demographic Developments in Europe 2001 (2001): tables T3.1 and T4.1; CELADE, Boletin demografico 69 (2002): tables 4 and 7; Francisco Alba-Hernandez, La poblacion de Mexico (1976): 14; and UN Population Division, World Population Prospects: The 2002 Revision (2003): 326. Demographic Transition in Sweden and Mexico
Law of 70 • The unprecedented population growth of modern times heightens interest in the notion of doubling time. • Calculation of population doubling time is facilitated by the Law of 70 • If a population is growing at a constant rate of 1% per year, it can be expected to double approximately every 70 years • -- if the rate of growth is 2%, then the expected doubling time is 70/2 or 35 years.
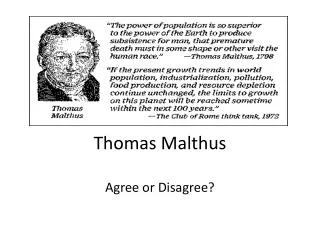
Malthus (1766-1834) • Population issues of fertility and mortality or births and deaths • In his Essay on the Principle of Population, initially published in 1798, Malthus postulated that population tended to grow geometrically while the means of subsistence (food) grew only arithmetically • Mathusian Trap – Gap (gap cannot persist indefinitely) • arithmetic growth (food):1, 2, 3, 4, 5, 6, 7, 8, 9, 10… • geometric growth (population):1, 2, 4, 8, 16, 32, 64, 128, 256, 512… • Malthus argued that the difference between geometric and arithmetic growth caused a tension between the growth of population and that of the means of subsistence
Food & Population, 1950-2000Malthus vs. Actual Trends Fig. 2-20: Malthus predicted population would grow faster than food production, but food production actually expanded faster than population in the 2nd half of the 20th century.
Fallacies in theory • War, hunger, disease, vice, morality served as a positive check on population growth • Preventive checks: birth control through • later age at marriage • abstinence from sex outside marriage. • Malthus opposed artificial methods of birth control on moral grounds. • Viewed contraception as a vice • Contrary to Malthus’s prediction, mortality (death rate) has not yet risen to curb world population growth • 1 billion people in 1800 - 6 billion end of 20th century • Malthus did not forsee the population explosion • He did not recognize the force of the Industrial Revolution which produced exponential growth in the means of subsistence
Malthus and Marx Today • Neo-Malthusians - Believe we are approaching, or have already surpassed, the earth’s carrying capacity. • We should make over-population issues our first priority. • Neo-Marxists - Believe eliminating oppression and poverty through social justice is the only solution to the population problem. • Wealth and resource distribution must be addressed.
The Demographic Transition in Developed and Developing Countries
Population Pyramids Graphic representation of a population Shows age-sex composition Broad base = high fertility and mortality Narrow base = low fertility and mortality
CAMEROON 2000 2050 USA JAPAN
Female Labor Force Participation Rates Vary Widely around the World…
Modernization Theory • Macro-level theory that sees human actors as being buffeted by changing social institutions. • Individuals did not deliberately lower their risk of death to precipitate the modern decline in mortality. • Society wide increases in income and improved public health infrastructure brought about this change.
World Population Growth1950 - 2005 Fig. 2-6: Total world population increased from 2.5 to over 6 billion in slightly over 50 years. The natural increase rate peaked in the early 1960s and has declined since, but the number of people added each year did not peak until 1990.
Life Expectancy at birth Fig. 2-11: Life expectancy at birth is the average number of years a newborn infant can expect to live. The highest life expectancies are generally in the wealthiest countries, and the lowest in the poorest countries.
Crude Death Rates Fig. 2-12: The crude death rate (CDR) is the total number of deaths in a country per 1000 population per year. Because wealthy countries are in a late stage of the Demographic Transition, they often have a higher CDR than poorer countries.
Population Pyramids in U.S. cities Fig. 2-16: Population pyramids can vary greatly with different fertility rates (Laredo vs. Honolulu), or among military bases (Unalaska), college towns (Lawrence), and retirement communities (Naples).
HIV/AIDS Prevalence Rates, 2005 Fig. 2-26: The highest HIV infection rates are in sub-Saharan Africa. India and China have large numbers of cases, but lower infection rates at present.
What do population statistics tell us about the development of a country?
Population and development Not like the brazen giant of Greek fame, With conquering limbs astride from land to land; Here at our sea-washed, sunset gates shall stand A mighty woman with a torch, whose flame Is the imprisoned lightning, and her name Mother of Exiles. From her beacon-hand Glows world-wide welcome; her mild eyes command The air-bridged harbor that twin cities frame. "Keep ancient lands, your storied pomp!" cries she With silent lips. "Give me your tired, your poor, Your huddled masses yearning to breathe free, The wretched refuse of your teeming shore. Send these, the homeless, tempest-tost to me, I lift my lamp beside the golden door!"