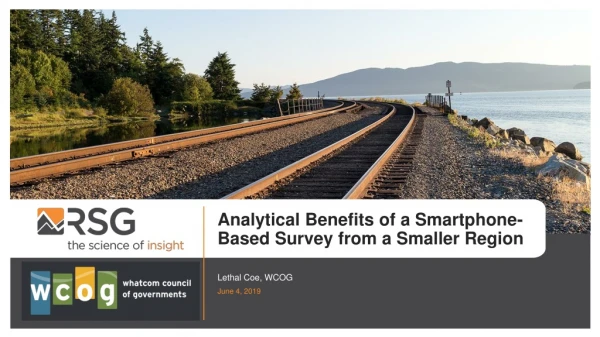
Analytical Benefits of a Smartphone-Based Survey from a Smaller Region
Analytical Benefits of a Smartphone-Based Survey from a Smaller Region. Lethal Coe, WCOG. June 4, 2019. Presentation Overview. About WCOG and the study region How we use our travel survey data About the 2018 travel survey Benefits of multi-day smartphone survey data

Analytical Benefits of a Smartphone-Based Survey from a Smaller Region
E N D
Presentation Transcript
Analytical Benefits of a Smartphone-Based Survey from a Smaller Region Lethal Coe, WCOG June 4, 2019
Presentation Overview About WCOG and the study region How we use our travel survey data About the 2018 travel survey Benefits of multi-day smartphone survey data Key takeaways and next steps
About WCOG and the Study Region The Whatcom Council of Governments (WCOG) provides a variety of services and programs for the 90K+ households (210K+ residents) of Whatcom Regionin NW Washington. Study Region: 45 miles south of Vancouver, B.C. 90 miles north of Seattle, WA Key Transportation Topics: High passenger and freight volume at U.S. – Canadian border crossing Increase in ride-hailing / decrease in bus ridership Increase in urban bicycling Rapid population growth in past 10 years (many who commute to jobs outside the region)
WCOG uses survey data for several purposes, including: General transportation planning Regional long-range transportation plan County-wide comprehensive plan City-level comprehensive plans Transit planning Border transportation planning Corridor and sub-area planning Trip-based travel demand modeling Trip rates by purpose and mode Trip origins and destinations Trip distance and time-of-day distributions Active transportation planning Smart Trips program support City of Bellingham “complete networks” implementation – Transportation Report on Annual Mobility (TRAM) Understanding special travel markets College and university student travel Cross-border travel (of residents) Long-distance commuters to Seattle & Vancouver
The 2018 WCOG HTS covered 1,451 households, with 60% using smartphones to collect travel data for up to 7 days. 2018 Study Design: • Online “recruitment” survey. • 7-day smartphone or 1-day online travel diary. • Gift-card incentives varied based on survey method. High-Level Results: • 1.8% final sample rate* • 3,000 persons in complete households • 13,107 complete person-days of travel • 47,874 trips on complete travel days Travel Diary Method (Among Complete Households) * Sample Rate = Households in Final Sample / Total Households in Region.
The smartphone-based study approach helped provide greater quantity and quality data, supporting many WCOG’s use cases. This presentation will specifically focus on the study’s impacts on: • Increased person and trip counts for rare and important behaviors • Trip rate analysis (smartphone vs. online) • Spatial coverage
Multi-day data collection provided more insight into rare travel behaviorsand weekend-specific travel. 24 Persons Made Trips to British Columbia on Day 1 131% Increase in Unique Bicyclists 196% Increase in Cross-Border Travelers 112 Persons Biked on Day 1 147 Persons Biked Only Days 2-7 71 Persons Made Trips to British Columbia Only Days 2-7
The smartphone approach resulted in higher trip rates overall, including non-auto trips (walk, bike, transit).
Smartphone data collection captured more accurate trip counts compared to the manual data collection.
Smartphones collected higher shares of short-distance trips compared to the manual data collection.
Smartphone participants were younger and matched the population age distribution more closely. *Population is represented by weighted data figures.
Higher trip counts also increased spatial coverage across study and neighboring regions. Work trip ends (with added noise to preserve anonymity)
Key Takeaways and Next Steps Key Takeaways From the Study • Smartphone-based survey collected richer and more representative travel data. • Smartphone data collection captured higher trip rates overall, partially due to the higher share of short-distance and easy-to-forget trips. • Multi-day data collection significantly increased the size of our dataset. • Combined smart-phone diary (60%) and traditional online/phone diary (40%) captured optimal demographic representation. • Persons over 65 and lower income households still needed online option. Next Steps • Develop webpage (wcog.org) that includes access to data and reports. • Further investigate trip makings and location-based data. • Perform subarea analyses.
LETHAL COE, WCOG SENIOR PLANNER Lethal@wcog.org CHRISTOPHER COY, RSG SENIOR CONSULTANT Christopher.coy@rsginc.com ABIGAIL ROSENSON, RSG ANALYST Abigail.rosenson@rsginc.com ELIZABETH GREENE, RSG DIRECTOR Elizabeth.greene@rsginc.com