Download
1 / 15
150 likes | 287 Vues
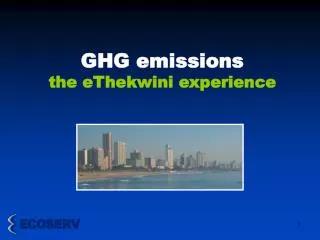
GHG emissions the eThekwini experience. GHG Emission Inventory. GHG reporting in Durban. Two previous inventories 2002 Full GHG emission inventory – data collected for Municipal contribution and estimated for Community or City-wide contribution

E N D
GHG reporting in Durban Two previous inventories • 2002 Full GHG emission inventory – data collected for Municipal contribution and estimated for Community or City-wide contribution • 2004 The data collection was repeated and a summary published • Emissions from the greater Durban community (estimates only) • Data used to inform EMD Energy Efficiency project
eThekwini’s Approach: HEAT • Online GHG emission calculator of ICLEI • EMD existing relationship with ICLEI Local Governments for Sustainability • Improvement on Torrie Smith methodology • http://heat.iclei.org • A database that EMD could review and maintain themselves
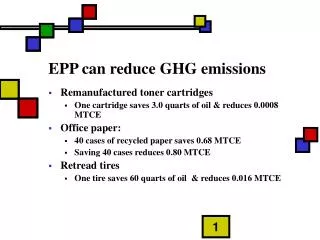
What is HEAT? • Online software to support local greenhouse gas and air pollution emission reduction planning • Build an emissions inventory based on local energy use, transportation demand, and waste practices • Help a user/city build a simple emissions forecast • Set a target/goal for reducing emissions (e.g., reduce GHG emissions by 10%) • Provide a database for storage of emission data • Calculations using emission factors • Quantify emission reduction activities and their co-benefits
Government inventory categories Government Structure: • Buildings • Vehicle fleet • Employee commute • Streetlights • Water/sewage • Waste • Other
Community inventory categories Community Structure: • Residential • Commercial • Industrial • Transportation • Waste • Other
GHG data collection • Contacted local Municipal departments • Contacted EMD staff collecting the same data for SOER and State of Energy Department • Worked with Enviros, State of Energy Report • Major data contributor, South Africa Petroleum Industries Association • Sugar Milling Research Institute • eThekwini Electricity
Observations • Future reports should concentrate on addressing gaps in the data • Various shortcomings in the software were identified – addressed ahead of future projects • Verification of data at point of origin
ECOSERV Pty LtdEcoserv and AER are now part of SGS Environmental Business Services. The SGS Group is the world’s leading inspection, verification, testing and certification company. Mia Antoni