Chapter 5 Exploring Data: Distributions
This chapter provides a comprehensive overview of statistics, focusing on the nature of data, various distributions, and methods to analyze and represent data visually. Key topics include creating and interpreting histograms and stemplots, computing mean, median, quartiles, variance, and standard deviation, as well as understanding the normal distribution and its applications. Additionally, it discusses the five-number summary and introduces boxplots as a visual tool for data representation. Practical examples and exercises reinforce the concepts presented, making them accessible for learners.

Chapter 5 Exploring Data: Distributions
E N D
Presentation Transcript
Chapter 5Exploring Data: Distributions February 9, 2010 Brandon Groeger
Outline • What is Statistics? • Data • Distributions • Histograms • Stemplots • Mean, Median, and Quartiles • Standard Deviation and Variance • Normal Distribution • Extensions and Applications • Discussion
What is Statistics? • “Statistics is the science of collecting, organizing and interpreting data” • Statistical inference is drawing conclusions from data.
Data • Data is information about an individual or a group of individuals (a population). • “A variable is any characteristic of a individual”
Distribution • “The distribution of a variable tells us what values the variable takes and how often it takes these values.” • Graphical representations of data make seeing patterns easier.
Making a Histogram • Step 1: Define a set of equally sized classes • Step 2: Determine the number of individuals in each class. • Step 3: Draw the histogram
Interpreting Histograms • Look for patterns, shape, the center, and spread. • Distributions can be symmetric or skewed. • An outlier is “an individual value that falls outside the overall pattern.”
Stemplots • 30 Test Scores(41, 52, 58, 63, 64, 65, 68, 70, 71, 71, 72, 75, 79, 82, 82, 83, 84, 85, 88, 89, 89, 90, 91, 92, 94, 98, 99, 100, 100, 100) • In this stemplot the left column(the stem) represents the “tens place” of each test score and the right column(the leaf) represents the “ones place”. • Stemplots can be easier to read and more detailed than Histograms for small amounts of data.
Describing the Center: Mean • The mean of a set of data is the sum of the data divided by the number of data points. • Mean = • Example: Heights (64, 67, 71, 78) • Mean = (64 + 67 + 71 + 78)/4 = 280/4 = 70
Describing the Center: Median • “The median is the midpoint of a distribution, the number such that half of the observations are smaller and the other half are larger.” • Finding the median: • Arrange the data in order from smallest to largest • If the number of data points (n) is odd:median = the entry (n+1)/2 • If n is even: median = the average of entry (n/2) and (n+1)/2 • Example: 30 Test Scores(41, 52, 58, 63, 64, 65, 68, 70, 71, 71, 72, 75, 79, 82, 82, 83, 84, 85, 88, 89, 89, 90, 91, 92, 94, 98, 99, 100, 100, 100) • Median = Average(82,83) = 82.5
Describing Spread: Quartiles • Quartiles divide a data set into four pieces, where each quartile has one quarter of the data points. • Finding the quartiles of a data set: • Find the median of the set this is the half way point (1/2) which is the 2nd quartile (2/4). • Take all of the data points smaller than the median and find their median this is the 1st quartile. • Take all of the data points larger than the median and find their median this is the 3rd quartile .
Five Number Summary • The five number summary of a distribution is the minimum, the 3 quartiles, and the maximum written in order. • Example: 30 Test Scores(41, 52, 58, 63, 64, 65, 68, 70, 71, 71, 72, 75, 79, 82, 82, 83, 84, 85, 88, 89, 89, 90, 91, 92, 94, 98, 99, 100, 100, 100) • Minimum = 41, 1st Quartile = 70, Median = 2nd Quartile= 82.5,3rd Quartile = 91, Maximum = 100
Boxplots • “A boxplot is a graph of the five number summary”
Practice • Make a boxplot for the following set of monthly S&P500 returns (-3.5%, -0.6% 4.8%, 1.1%, -8.6%, -1.0%, 1.2%, -9.1%, -16.9%, -7.5%, 0.8%, -8.6%, -11.0%, 8.5%, 9.4%, 5.3%, 0.0%, 7.4%, 3.4%, 3.6%, -2.0%, 5.7%, 1.8%) • Minimum: -16.9% • 1st Quartile: -5.5% • Median: 0.8% • 3rd Quartile: 3.4% • Maximum: 9.4%
Describing Spread: Standard Deviation & Variance • “The variance (s2) of a set of observations is an average of the squares of the deviations of the observations from their mean.” • “The standard deviation (s) is the square root of the variance.” • Note: Standard deviation is often calculated using n as the denominator instead of n-1. This is called Bessel’s correction, which corrects for bias.
Standard Deviation Example • Weights in lbs: (130, 150, 160, 180) • Mean = 155 lbs • Variance = s2 = ((130-155) 2 + (150-155) 2 + (160-155) 2 + (180-155) 2 ) / (4-1) = 433.33 • Standard deviation = s = (433.33)1/2 = 20.82 lbs
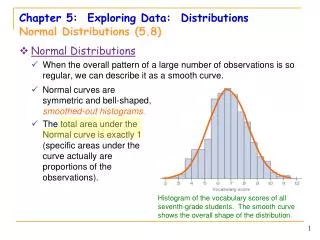
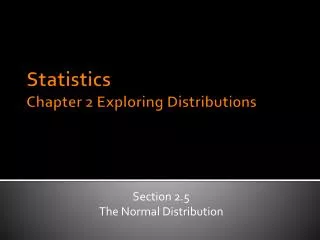
Normal Distributions • A normal curve is the graph of a normal distribution, which is one of many types of distributions. • Many data sets including the height of humans roughly follow a normal distribution. • 68-95-99.7 rule A Normal Curve
Extensions • Other distributions • Uniform, Exponential, Gamma • Regression analysis and fitting a trend line • Other Statistics • Geometric mean, Mode, Kurtosis
Applications • Manufacturing • Insurance • Investment/Banking • Marketing • Biology • Business Management • The Census
Trivia • Abraham Wald (1902-1950): Where should extra armor be added to WWII combat aircraft? • 1999 Mars Climate Orbiter Crash • 22% of American high school students reported they smoke, but only 9.7% said that they smoked 20 out of the past 30 days.
Discussion • Questions? • Can you think of other extensions or applications? • How can you use statistics in everyday life? • Homework: (7th edition) #9, 30a-b