Chapter 5 Describing Distributions Numerically
Chapter 5 Describing Distributions Numerically. AP Statistics. Center and Spread. In this chapter, we will eliminate much of the vagueness of finding the center and spread of a distribution The values we use will be determined by the shape of the distribution. Skewed Distribution .

Chapter 5 Describing Distributions Numerically
E N D
Presentation Transcript
Chapter 5Describing Distributions Numerically AP Statistics
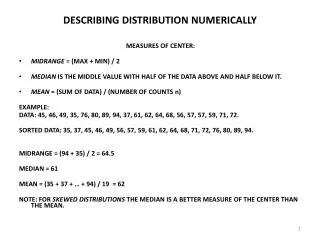
Center and Spread • In this chapter, we will eliminate much of the vagueness of finding the center and spread of a distribution • The values we use will be determined by the shape of the distribution
Skewed Distribution • Center: Median • Spread: Interquartile Range (IQR) • Both of these are “resistant” • Both should include units
Skewed Distribution How to find the IQR 1. Find median 2. Find the median of both halves of data the lower median is 1st Quartile the upper median is 3rd Quartile 3. Subtract the two quartile scores ** 1st Quartile = 25th percentile ** 3rd Quartile = 75th percentile
Outliers • Really just data that seems unusual • Formally we compute fences and if data point is outside the fences, we consider it an outlier • Always use common sense • Upper fence: • Lower fence:
5-Number Summary and Boxplots The five number summary is used to create a boxplot
Boxplot • Complement histograms by providing more specific information • Look at histogram and boxplot together • Most useful when comparing distributions
Symmetric Distributions • Center: Mean • Spread: Standard Deviation • Both are not “resistant” • Both should include units
Standard Deviation • Takes into account how far each value in a data set is from the mean Formula: Find the standard deviation: 10, 14, 15, 16, 20
Properties of standard deviation • Only use with mean • If s = 0, there is no spread and all data pieces are same—other wise s>0 and s gets larger as data pieces get more spread out. • A few outliers can really change the value of the standard deviation
Distributions with Outliers • Tricky situation • Since outliers affect mean and standard deviation, it is usually better to use median and IQR • However, if the distribution is unimodal—use mean and median and just report outliers separately • However, if you find a simple reason for outlier (input), eliminate it and use mean and standard devation—if symmetric
Other information • If distribution is symmetric, then mean=median • If skewed right, mean>median • If skewed left, mean<median • Spread of distribution is just as important as the center • How accurate: one or two decimal points more than original data • Reexpress data???