Describing Distributions Numerically
Describing Distributions Numerically. Measures of Variation And Boxplots. Boxplots. Range: highest number - lowest number Five number summary: Minimum Q1 Median Q3 Maximum. Boxplot Continued. Interquartile Range: IQR = Q3 - Q1


Describing Distributions Numerically
E N D
Presentation Transcript
Describing Distributions Numerically Measures of Variation And Boxplots
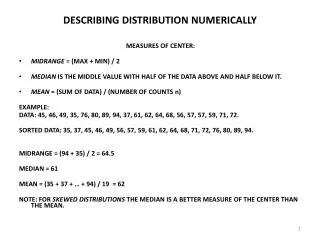
Boxplots Range: highest number - lowest number Five number summary: Minimum Q1 Median Q3 Maximum
Boxplot Continued Interquartile Range: IQR = Q3 - Q1 *Tells us how much territory the middle half of the data covers. Percentile: for whole number P (where 1≤P≤99), the Pth percentile of a distribution is a value such that P% of the data fall at or below it and (100-P)% of the data fall at or above it.
Histogram Median-splits the histogram into two halves with equal area Mean-point at which the histogram would balance
Measures of Variation Deviation: how far each data value is from the mean Variance (s2): average (almost) of squared deviations Standard Deviation (s):
Thinking about Variation… The U.S. Census Bureau reports the median family income in its summary of census data. Why do you suppose they use the median instead of the mean? What might be the disadvantages of reporting the mean?
Thinking about Variation… You’ve just bought a new car that claims to get a highway fuel efficiency of 31 mpg. Of course, your mileage will vary. If you had to guess, would you expect the IQR of gas mileage attained by all cars like yours be 30 mpg, 3 mpg, or 0.3 mpg? Why?
Thinking about Variation… A company selling a new MP3 player advertises that the player has a mean lifetime of 5 years. If you were in charge of quality control at the factory, would you prefer that the standard deviation of lifespans of the players you produce be 2 years or 2 months? Why?
Rules about shape, center, and spread • If the shape is skewed, report the median and IQR. • If the shape is symmetrical, report the mean and standard deviation. IQR is usually larger than the standard deviation. • If outliers, report mean and standard deviation with outliers present and with outliers removed.
Summarizing a DistributionA man owned a 1989 Nissan Maxima for 8 years. Being a statistician, he recorded the car’s fuel efficiency (in mpg) each time he filled the tank. He wanted to know what fuel efficiency to expect as “ordinary” for his car. Knowing this, he was able to predict when he’d need to fill the tank again, and notice if the fuel efficiency suddenly got worse, which could be a sign of trouble. What does the data say?
When comparing boxplots • Compare the medians, which group has the higher center? • Compare the IQRs; which group is more spread out? • Judged by the size of the IQRs, are the medians very different? • Check for possible outliers. Identify them if you can.
Comparing BoxplotsA student designed an experiment to test the efficiency of various coffee containers by placing hot liquid in each of 4 different containers types 8 different times. After 30 minutes she measured the temperature again and recorded the difference in temperature. What can we say about the effectiveness of these four mugs?*Because these are temperature differences, smaller differences mean that the liquid stayed hot.
Measure of Variation Continued Coefficient of Variation: Chebyshev’s Theorem: