Union Density 1964 = 29%
Union Density 1964 = 29%. 0% to 9%. 10% to 20%. 21% to 30%. 31% +. Source: U.S. Department of Labor. Union Density 1984 = 19%. 0% to 9%. 10% to 20%. 21% to 30%. 31 % +. Source: U.S. Department of Labor. Union Density 2004 = 13%. 0% to 9%. 10% to 20%. 21% to 30%. 31% +.

Union Density 1964 = 29%
E N D
Presentation Transcript
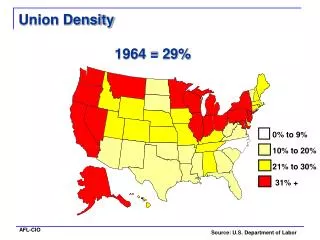
Union Density 1964 = 29% 0% to 9% 10% to 20% 21% to 30% 31% + Source: U.S. Department of Labor
Union Density 1984 = 19% 0% to 9% 10% to 20% 21% to 30% 31% + Source: U.S. Department of Labor
Union Density 2004 = 13% 0% to 9% 10% to 20% 21% to 30% 31% + Source: U.S. Department of Labor
116% 97% 103% 98% 85% Poorest 20% Middle 20% Next Poorest 20% Next Richest 20% Richest 20% 1947-1973 1973-2005 Source: Economic Policy Institute Growing Together… Growing Apart Off the charts! 513% income rise 353% Household Income Distribution 200 % Increase 150 100 64% 50 38% 23% 12% 3% 0 Top 0.1%* Top 0.01%*
Workers’ Wages and Executive Pay For large U.S. corporations surveyed by Business Week magazine Source:Institute for Policy Studies and United for a Fair Economy