Download
1 / 38
380 likes | 533 Vues
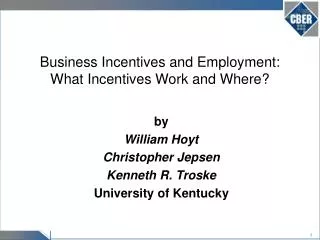
Business Incentives and Employment: What Incentives Work and Where?. by William Hoyt Christopher Jepsen Kenneth R. Troske University of Kentucky. Introduction .

E N D
Business Incentives and Employment: What Incentives Work and Where? by William Hoyt Christopher Jepsen Kenneth R. Troske University of Kentucky
Introduction • Offering incentives to businesses considering locating in a state, or offering incentives to try and keep businesses from leaving a state, has become wide spread in recent years.
Introduction • One reason offering incentives remains controversial is the lack of rigorous empirical analysis assessing the effectiveness of these programs • Researchers usually know the value of the incentive “awarded” to a firm but not the value of the incentive actually taken by the firm • Since there are large differences between the amount of incentives awarded and the amount claimed only having data on incentives awarded will lead researchers to understate the effectiveness of incentives
Introduction • We study incentives using data containing information on the incentives both awarded to and received by firms in Kentucky between 1992 to 2004 • We evaluate the effect of these incentives on employment using panel data of Kentucky counties • We focus on the effect of incentives on employment growth since job creation is a primary goal of the program
Introduction • There are a couple of aspects about Kentucky that help in our evaluation • Kentucky has a large number of counties (120), so we can study the impact of these programs on a relatively large number of small areas • Also examine the impact of these programs on neighboring counties
Introduction • There are a couple of aspects about Kentucky that help in our evaluation • Kentucky shares a border with a number of different states, so we can examine whether these programs simply shift employment from one region of the state to another, or whether they help attract businesses from other states
Previous studies • Somewhat limited literature examining the effect of economic development programs on economic growth • Much of the previous research assumes that incentives are awarded to firms at randon, which we know is not true • Previous researchers also tend to assume that the effect of incentives will be instantaneous
Previous studies • Most informative and rigorous previous work on tax incentives is Greenstone and Moretti (2003) • Compared changes in property values of counties that won “million dollar” plants with counties that lost • Winning counties grow faster after winning • They don’t have data on size of the incentive so they can’t say whether the benefits exceed the cost
Previous Studies • Advantage of this study over most of the previous studies • County-level information on actual incentives received by firms in a county as opposed to incentives awarded • Data for a large number of years (1992-2005) • Better controls for non-random receipt of incentives • Allow the effect of incentives to occur with a lag
Data and Methodology • Panel data of 120 Kentucky counties from 1992 to 2005 • Preferred specification uses two-year lag for incentives, reducing panel to 1994 to 2005 • Data on incentives received in each county and year, from Cabinet for Economic Development • Dependent variable is county-level employment
Kentucky’s Business Incentive Programs • For our study we divide the incentive programs into three groups: • Tax Incentives (KIDA, KREDA, KJDA, KIRA) • Training Incentives (BSSC) • Financing Incentives (KEDFA, EDB)
Data and Methodology • Our analysis is based on regressions where: • The dependent variable is log employment in a county • The key independent variables are the log amounts of tax, training and financing incentives received • We also control for the demographic characteristics of county residents as well as other government expenditures and taxes and the year • Also control for unobserved aspects of the county that are fixed over time
Data and Methodology • When examining the impact of incentives on economic activity, we look at how incentives received two years ago impact economic activity in the current year • For example, we look at the impact of incentives taken in 2000 on employment growth in a county in 2002
Data and Methodology • There are a number of reasons why it may take a couple of years before we see the economic impact of the incentives • A firm may continue to grow for a number of years after receiving the incentive • When a firm hires workers, these workers spend more money in a community, impacting other businesses in the area. It may take a couple of years for these indirect effects to be seen.
Data and Methodology • In much of our work, we separate the counties into those that border other states and those in the interior of the state • Counties on the border compete with other states (with different incentive programs) for companies • Interior counties compete primarily with other Kentucky counties
Data and Methodology • Other factors we consider: • Whether incentives have different effects in urban areas compared to rural areas • Whether incentives have spillover effects into neighboring counties • Using other measures of employment from BLS, we examine how incentives might impact employment for residents in a county
Results • Start by looking at the use of business incentives over time and across different regions of the state
Amount of Business Incentives Taken as Percentage of Earnings, 1992 to 2004
Amount of Business Incentives • Overall amount of business incentives are fairly small relative to the size of the economy • The combined amount of all programs in a year never exceeds 0.2% of total earnings in the state • In 2003 the amount of the incentives was less than 10% of business taxes collected • In 2003 amount of incentives was less than 1% of total state government revenue • Incentives can represent a significant decrease in taxes for an individual firm
Tax Incentives Claimed as Percentage of Tax Incentives Awarded
Value of Incentives Claimed vs. Awarded • Only a small percentage of tax incentives awarded are ever claimed • By 2004 only 12% of incentives awarded had been claimed • Shows that it is important to use tax incentives claimed when studying the impact of incentives
Ranking of Counties by Total Value of Incentives Relative to Total Earnings
Effects of Business Incentives on Employment • Results from our regressions show that • Both training incentives and tax incentives have positive and significant effects on employment in a county, but only in border counties; they have no significant effect in interior counties • Financing incentives never have significant effects on employment in any county
Size of the Effects • Using these coefficients, we can estimate the impact of a 10% increase in incentives received by businesses operating in a county on employment in a county • Mean training incentive in border counties is $33,927, so a 10% increase is $3,393 • Mean tax incentives in border counties is $551,204, so a 10% increase is $55,120 • Mean employment in border county is 26,986
Effects of Business Incentives on Employment • Employment effects seem small, but keep in mind • The spending on these programs is small relative to the size of the economy • Training incentives average about 0.01% of earnings while tax incentives average about 0.08% of earnings • Effects are large relative to other estimates of the employment effects of a tax cut
Effects of Business Incentives on Employment • Several possible reasons why training incentives have large effects relative to their size • Amount available was restricted by the legislature ($2.5 million/year) • Low skill of workers is a serious problem in Kentucky • Training provides workers with skills which they keep even if the are no longer working for the firm
Differing Effects of Incentives Between non-MSA and MSA Border Counties
Differing Effects of Incentives Between non-MSA and MSA Border Counties • Training incentives have a positive and significant impact on employment in both MSA and non-MSA border counties • Tax incentives have a positive and significant impact on employment only in MSA border counties
Spillover Effects of Incentives • We examine the impact that incentives received by a business operating in one county has on employment in surrounding counties • We find no significant effect on employment in surrounding counties • Incentives do not appear to simply shift employment from one county to another within a state, nor do they lead to growth in economic activity in other counties
Long-Run Effects of Incentives • We find that the effects of incentives on county employment are persistent • We find significant effects for training incentives for three years after the incentives were received • We find significant effects of tax incentives for five years after the incentives were received
Effects of Incentives on Unemployment and Labor Force Participation • We looked at how incentives lead to an increase in employment • We find that training incentives tend to increase the size of the labor force in a county • These incentives work by drawing workers back into the labor market • We find that tax incentives work by reducing the number of unemployed workers in a county
Summary • Training and tax incentives have positive effects on employment in border counties • Training incentives have positive effects in all border counties while tax incentives only have significant effects in MSA border counties • Financing incentives have no affect in any county • No evidence of spillover effects between counties • Effects appear to persist for several years
Concluding Thoughts • I find the results for training incentives one of the more interesting findings in the study • The effects are quite large given that relatively little money is spent on the program • This is the only program to have any impact in rural areas • We would like to learn more about how this program is administered and what training is provided • Training appears to be fairly general
Concluding Thoughts • It would be interesting to compare the effect of receiving training through one’s firm with the effect of training received through federal programs such as the Workforce Investment Act (WIA)