Download
1 / 18
180 likes | 317 Vues
New proposals for measuring Event-Related Phase Synchrony. Alfonso Alba Cadena Advisors: José Luis Marroquín (CIMAT) Thalía Harmony (INB-UNAM) Collaborators: Joaquín Peña (CIMAT) Bertha González (INB-UNAM). Introduction.

E N D
New proposals for measuring Event-Related Phase Synchrony Alfonso Alba CadenaAdvisors: José Luis Marroquín (CIMAT) Thalía Harmony (INB-UNAM) Collaborators: Joaquín Peña (CIMAT) Bertha González (INB-UNAM)
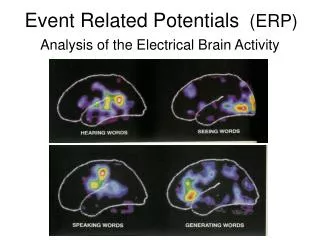
Introduction • During cognitive tasks, different brain regions integrate and interact with each other. (Friston et al., 1997). These interactions are reflected in EEG measurings as synchrony between electrode signals. • We have developed an analysis/visualization system that allows one to explore event-related synchrony patterns within the time-frequency plane. This may be done at different time-scales in order to highlight different structures. Varela et al., 2001
Overview Raw EEG signals(potentials) Cortical Radial Source signals Filtered signals Phase-lock measure Synchrony patterns (for each TF point) Bayesian classification TFT Synchrony Histograms Segmented synchrony maps
Visualization of synchrony patterns For each pair of electrodes, Bayesian estimation is performed to determine whether their phase-lock (at each time and frequency) is significantly higher (red), lower (green) or equal to the pre-stimulus average.
TFT Synchrony Histograms For each electrode, we count the number of sites with which its phase-lock measure either significantly increased (SIH) or decreased (SDH). This is a measure of the involvement of each electrode in synchronous processes. Synchrony Increase Histogram Synchrony Decrease Histogram
Segmented TF Maps We can also calculate and display the average synchrony pattern for specific regions on the TF-plane.
Methodology key-points • Projection of potentials to cortical radial sources to reduce volume conduction problems. • Carefully designed quadrature filters with reliable response at low tuning frequencies. • Straightforward instantaneous phase-lock measures. • Bayesian classification of significant synchrony changes which takes time-persistence into account. • Time-Frequency-Topography displays that allow predefined and interactive segmentations.
Projection to cortical radial sources One common technique to avoid the volume conduction and reference electrode problems consists on estimating the current source density (CSD) which is a multiple of the Surface Laplacian (SL) of the potentials. However, the phase estimates from these signals is very sensitive to noise and to the interpolation method used to estimate the SL. Instead, we propose to use the signals from virtual cortical sources located directly below the electrode sites. Each of these sources consists of a population of radial dipoles whose strength decreases exponentially with the distance to the central dipole.
Spherical quadrature filters For quadrature filters, the instantaneous phase of their output is well-defined. A quadrature filter can be defined as one that has null response at negative frequencies. Gabor filters tuned at low frequencies do not hold this property, which results in distorted phase estimations. Our solution consists on using spherical filters which have an asymetrical response at low tunings, such that the quadrature property is maintained [Guerrero, 2005].
Phase-lock measures Given the wrapped phase difference of two signals: Synchrony criteria [David and Friston, 2003] Phase-lock measures
Event-related phase-lock changes Instantaneous relative synchrony: Instantaneous mean relative synchrony (for single-trial measures):
Bayesian classification of persistent significant synchrony Bayesian estimation with a prior Markov Random Field (MRF) model [Marroquin, 1987] is used to classify significant changes in synchrony as higher (c=1), lower (c=-1) or equal (c=0), and also to include a persistence constraint. The posterior distribution of the class field c is given by: with The likelihoods P(Yr | c=cr) and prior distributions P(c=cr) can be estimated from the data using kernel density estimation.
Visualization and segmentation A TFT Synchrony histogram is helpful to recognize regions with homogeneous synchronization patterns.
Visualization and segmentation A TFT Synchrony histogram is helpful to recognize regions with homogeneous synchronization patterns. We can select these regions…
Visualization and segmentation A TFT Synchrony histogram is helpful to recognize regions with homogeneous synchronization patterns. We can select these regions… …and obtain the average pattern for each one of them.
Other synchrony measures Phase-LockingStatistic (PLS): [Lachaux et al., 1999] Single-Trial PLS (STPLS): [Lachaux et al., 2000] Coherence: [Gardner, 1992] [Bressler et al., 1993, 1995]
STPLS and Coherence Coherence STPLS 1 – (Local Phase Dispersion)