NLANR’s Active Measurement Program (AMP)
180 likes | 199 Vues
NLANR’s Active Measurement Program (AMP). Hans-Werner Braun NLANR (UCSD/SDSC) hwb@nlanr.net http://www.nlanr.net. Coral monitor (red). Coral monitor (red). Active measurements (green). NLANR network analysis infrastructure. Active measurements (green). Coral monitor (red).

NLANR’s Active Measurement Program (AMP)
E N D
Presentation Transcript
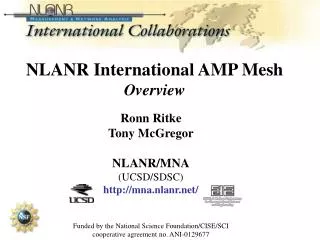
NLANR’sActive Measurement Program(AMP) Hans-Werner Braun NLANR (UCSD/SDSC) hwb@nlanr.net http://www.nlanr.net
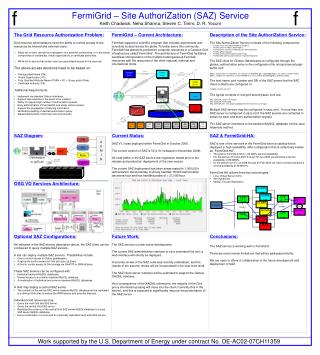
Coral monitor (red) Coral monitor (red) Active measurements (green) NLANR network analysis infrastructure Active measurements (green) Coral monitor (red) vBNS SNMP data (green) Routing data source (BGP) (green) storage and computation (red) storage, computation, and external presentations (green) compute engine (varies) compute engine (varies) compute engine (varies) compute engine (varies) External network access (web, ftp, email, ….) Data archival storage backend 12GB DDS3 tape, WORM, CD-RW, DVD-RAM (or green if encrypted) NAI system Network Analysis Infrastructure -- http://www.nlanr.net
Active measurement/analysis • Led by Tony McGregor (tonym@nlanr.net) • Focus on site-to-site across high performance networks • Attempt to deploy FreeBSD-based AMP machines at all HPC sites • almost 70 machines currently deployed and operational • Currently RTT, topology, and loss; user/event driven throughput • Current work provides base for: • validation of active measurement techniques • comparison of HP service provider internal measurements with site-to-site measurements Network Analysis Infrastructure -- http://www.nlanr.net
Active measurement environment Dept/ user Dept/ user HPC backbone network Site (campus) Site (campus) Dept/ user Dept/ user Dept/ user inner perimeter Dept/ user site perimeter user/application perimeter Network Analysis Infrastructure -- http://www.nlanr.net
Active measurementdeployment status UWashington Washington State U. Montana State UVermont NDSU UWisc- Milwaukee UOregon SDSMT Dartmouth UMichigan UIowa NTNU MIT UWyoming UMass BU FNAL Harvard PSC ColoState NCSA Princeton NCAR UDel WVU UCBoulder Kansas State UMd JHU IU UMissouri GMU NSF UCB ODU UKansas UVirginia Stanford SLAC Oklahoma State WUSTL UCSC NCREN UNC-CH Duke UCLA CSUPomona NCSU U New Mexico GATech UC-Irvine UCSD Mississippi State UAB SDSC UArizona Emory U. SDSU UA FSU Rice UFlorida UCF UMiami UWaikato 15 June 1999 Network Analysis Infrastructure -- http://www.nlanr.net
Major goals for AMP • Have a joint research/engineering agenda for the high performance community • third party site-to-site measurements between NSF supported HPC sites • to complement the intra-HPNSP measurements • to provide a common point of understanding of performance issues between HPNSPs and users • to work towards user-user and application-application performance assessments • to provide a base for further research • consider a more scalable, probably hierarchical system Network Analysis Infrastructure -- http://www.nlanr.net
Current measurements • We currently assess: • round trip time (RTT) • packet losses • topology (traceroute) • throughput • across all sites. • We are extending to all participating NS supported HPC sites: • NLANR provides the measurement machine and administration • the local site physically deploys the machine Network Analysis Infrastructure -- http://www.nlanr.net
AMP architecture • typically full mesh across AMP machines • some “destination-only” exceptions Active monitor Web browser Active monitor Analysis machine Active monitor Cichlid vis Other target Analysis machine • central data repository and visualization machines • data available via: • web interface to results • an NLANR developed 3D visualization tool (Cichlid) • raw data Network Analysis Infrastructure -- http://www.nlanr.net
AMP web info (1) Network Analysis Infrastructure -- http://www.nlanr.net
AMP web info (2) Network Analysis Infrastructure -- http://www.nlanr.net
AMP web info (3) Network Analysis Infrastructure -- http://www.nlanr.net
AMP web info (4) Network Analysis Infrastructure -- http://www.nlanr.net
AMP web info (5) Network Analysis Infrastructure -- http://www.nlanr.net
AMP web info (6) Network Analysis Infrastructure -- http://www.nlanr.net
AMP Routes Network Analysis Infrastructure -- http://www.nlanr.net
3D visualization, bar graphs • shows RTT as a moving time series • uses OpenGL tool that allows viewing from different perspectives, zoom, fly-through, etc. (developed by Jeff Brown) Network Analysis Infrastructure -- http://www.nlanr.net
3D visualization, terrain map • shows RTT as a rendered surface • rugged (noise reduced) terrain implies high and variable RTT; a rough network Network Analysis Infrastructure -- http://www.nlanr.net
Real-timeperformancequeries(access controlledto avoid misuse) Network Analysis Infrastructure -- http://www.nlanr.net