Download
1 / 1
10 likes | 75 Vues
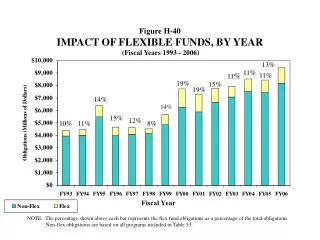
Explore the influence of flexible funds from 1993 to 2006 through percentages reflecting fund obligations in relation to total obligations. Delve into the significance of flex funds compared to non-flex obligations based on Table 53 programs.

E N D
Figure H-40IMPACT OF FLEXIBLE FUNDS, BY YEAR(Fiscal Years 1993 - 2006) 13% 11% 11% 11% 19% 15% 19% 14% 14% 15% 12% 10% 11% 8% NOTE: The percentage shown above each bar represents the flex fund obligations as a percentage of the total obligations. Non-flex obligations are based on all programs included in Table 53.