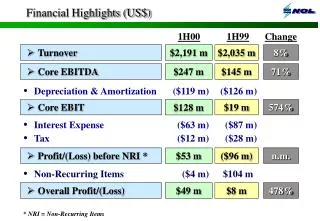
Financial Highlights and Strategy
Financial Highlights and Strategy. Rick Gunst Senior Vice President and Chief Financial Officer. Revenue Fiscal Years 1997-2006. In Millions. Net Income Fiscal Years 1997-2006. In Millions. Revenue First Nine Months. +12.6%. In Millions. Net Income and EPS First Nine Months. Net Income.


Financial Highlights and Strategy
E N D
Presentation Transcript
Financial Highlightsand Strategy Rick Gunst Senior Vice President and Chief Financial Officer
RevenueFiscal Years 1997-2006 In Millions
Net IncomeFiscal Years 1997-2006 In Millions
RevenueFirst Nine Months +12.6% In Millions
Net Income and EPSFirst Nine Months Net Income Earnings Per Share +92.8% +93.2% $M $0.17* $11.7* $0.68 $48.5 *Includes $12.4 million after-tax gains from DeVry University facility sales and $0.7 million in severance charges.
Segment Results DeVry UniversityFirst Nine Months Revenue Operating Income +8.9% +63.5% $M $M $19.8* $20.1 *Includes $20.9 million pre-tax gains from DeVry University facility sales and $1.1 million in severance charges.
Segment Results Medical and HealthcareFirst Nine Months Revenue Operating Income +27.2% +28.3% $M $M
Segment Results Professional and TrainingFirst Nine Months Revenue Operating Income +30.7% +39.3% $M $M
Opportunities for Margin ExpansionPre-Tax Income In Millions 3.8% 9.2% *Includes $20.9 million pre-tax gains from DeVry University facility sales and $1.1 million in severance charges.
DeVry University 12.5% 3.7%* (8.8) pts Medical & Healthcare - 37.4% +37.4 pts Professional & Training 28.6% 36.1% +7.5 pts Interest/Amort./Depr. (0.3)% (1.7)% (1.4) pts Total DeVry Inc. 13.2% 9.2% (4.0) pts Opportunities for Margin ExpansionFY’03-FY’07 Pre-Tax Operating Margin (%) YTD Q3 FY’03 YTD Q3 FY’07 B(W) *FY’07 results exclude facility sale gains and severance charge.
Workforce ReductionsFY 2007 Voluntary Separation 70 $1.1 $2.6 $3.7 Involuntary Separation 145 - $2.6 $2.6 215 $1.1 $5.2 $6.3 # of Employees Severance ($M) Q3 Q4 Total Cost Reductions of $10 Million Per Year in FY 2008 and Beyond
Real Estate StrategyOptimizing Large Campuses We are committed to every market we serve.
Substantial Debt Reduction In Millions
Financial Strategy Reduced debt levels Amended credit agreement Declared first dividend Initiated stock repurchase program Repurchased 194,000 shares for $5.3 million in Q3 FY 2007 Building Value for Our Shareholders
Financial Highlights Improving operating performance Strengthening financial position Enhancing shareholder returns Summary